
Figure 3.
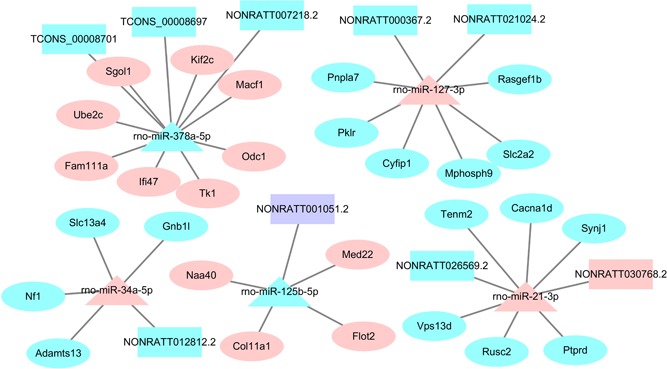
Core ceRNA network during the proliferative phase of rat LR. Rectangles, triangle, and ellipses represented DE lncRNAs, DE miRNAs, and DE mRNAs, respectively. Pink, light blue, and purple color represented upregulation, downregulation, and up/downregulation. CeRNA: competition endogenous RNA; DE: differently expressed; lncRNAs: long noncoding RNAs; miRNAs: microRNAs; mRNAs: messenger RNAs [Color figure can be viewed at wileyonlinelibrary.com]