
Figure 4.
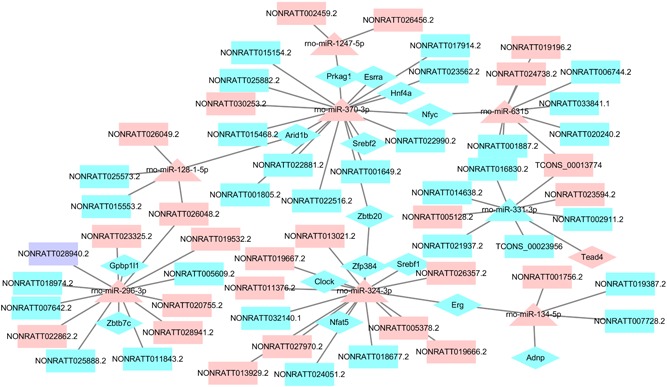
The regulatory network for TFs. Rectangles, triangle, and diamond represented DE lncRNAs, DE miRNAs, and TFs, respectively. Pink, light blue, and purple color represented upregulation, downregulation, and up/downregulation. DE: differently expressed; lncRNAs: long noncoding RNAs; miRNAs: microRNAs; TFs: transcription factors [Color figure can be viewed at wileyonlinelibrary.com]