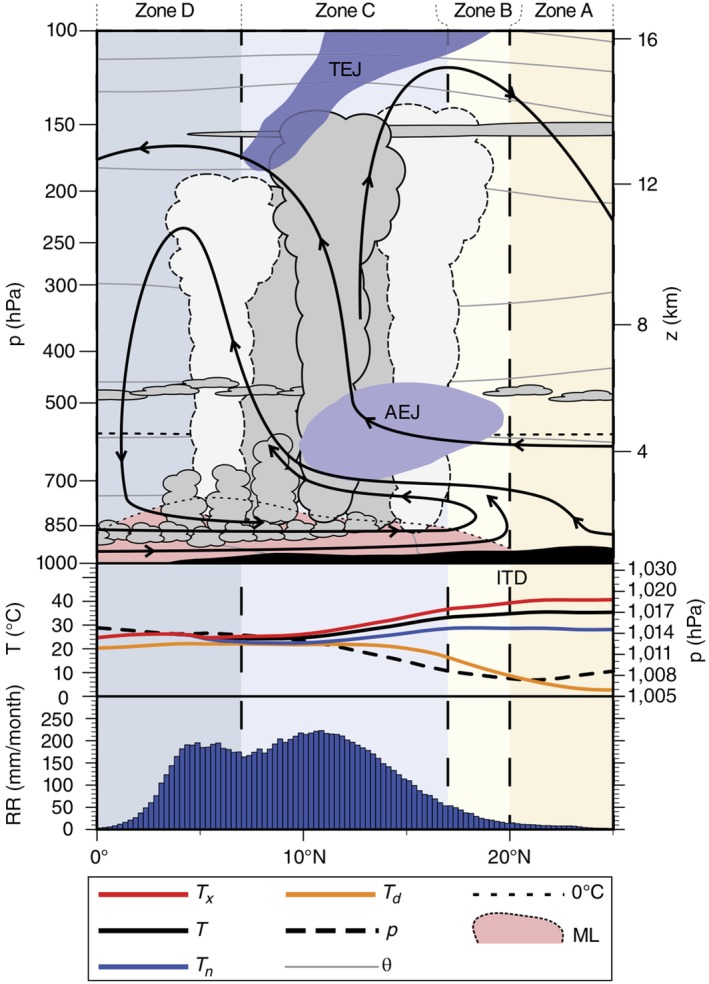
Figure 4.

Schematic cross‐section of the atmosphere between 10°W and 10°E in July. Shown are the positions of the ITD, upper‐level jet streams (African easterly jet [AEJ], tropical easterly jet [TEJ]), the monsoon layer (ML) (as defined by westerly, that is, positive, zonal winds), streamlines, clouds, the freezing level (0°C isotherm), isentropes (θ), minimum (Tn), maximum (T x) and mean (T) and dew point temperatures (T d), atmospheric pressures (p), and mean monthly rainfall totals (RR) (Reprinted with permission from Parker and Diop‐Kane (2017). Copyright 2017 Wiley)
