Figure 5.

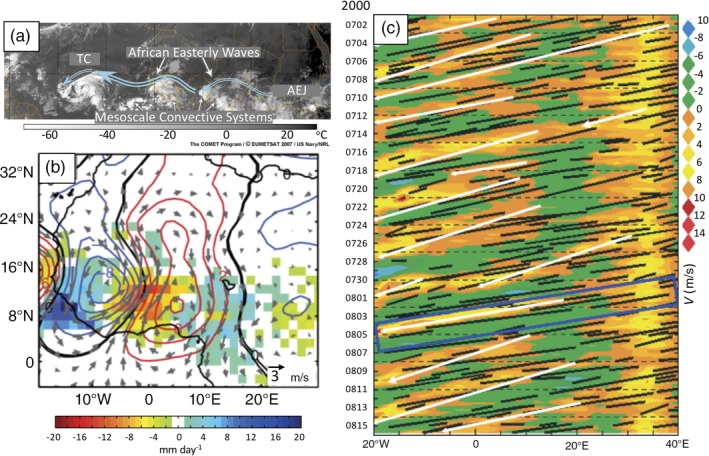
(a) Easterly waves can be observed in satellite imagery because of their associated convection. They appear as circular or banded clouds in satellite images. The source of this material is the COMET (textregistered) website at http://meted.ucar.edu/ of the University Corporation for Atmospheric Research (UCAR), sponsored in part through cooperative agreement(s) with the National Oceanic and Atmospheric Administration (NOAA), U.S. Department of Commerce (DOC). Copyright 1997–2017 University Corporation for Atmospheric Research. (b) Composite anomalies for 3‐ to 5‐day AEWs for the ERA‐I and TRMM observations. Vectors are 700 hPa wind anomalies (m/s). Red and blue contours are positive and negative 700 hPa geopotential height anomalies (m) drawn every 2 m. Black contours show the 0 m anomalies. Rainfall anomalies (mm/day) are shaded. Only anomalies above |1| mm/day that are significant at the 95% level according to a two‐tailed Student's t test are shown. (Reprinted with permission from Crétat, Vizy, and Cook (2014), Copyright 2014 Springer Nature). (c) Hovmüller (longitude–time) diagram of 850 hPa unfiltered meridional wind (v) and cold cloud streaks axes (black lines) averaged between 5°N and 15°N for the period July 1–August 15, 2001. Colored shading shows v at 2 m/s intervals; northerly winds are gold to red and southerly winds are green to blue. White lines are objectively computed positive meridional wind streaks used to identify AEWs. Cold cloud streaks have T b < 233 K. The blue rectangle identifies the convective systems and AEW from which Tropical Storm Alberto formed (Reprinted with permission from Laing, Carbone, Levizzani, and Tuttle (2008). Copyright 2008 the Royal Meteorological Society)
