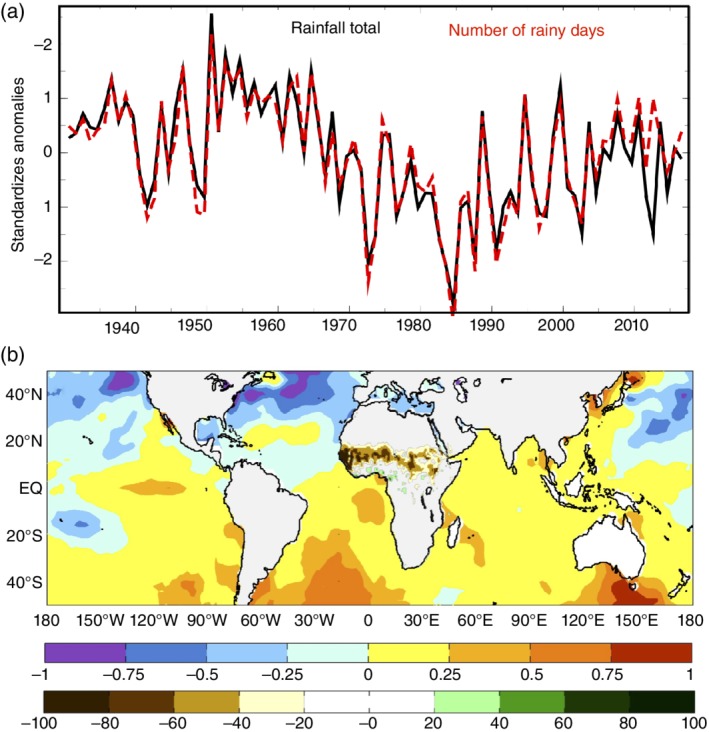
Figure 6.

(a) Summer‐mean (July to September) standardized anomalies in rainfall totals (black solid line) and number of rainy days (red dashed line) averaged over the region 10°N–20°N and 20°W–30°E (from the University of East Anglia Climate Research Unit gridded data set, TS4.1). (b) Linear trend in summer‐mean African rainfall between 1940 and 1985 (brown and green hues) and in annual‐mean sea surface temperatures over the same period (blue and orange hues) (Reprinted with permission from Biasutti (2011). Copyright 2011 Nature)
