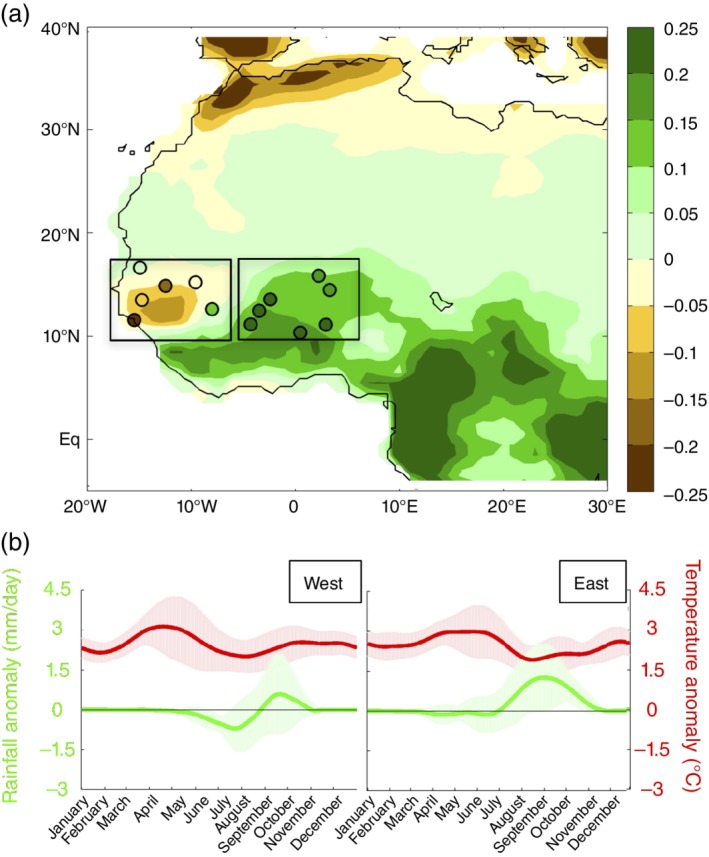
Figure 7.

Top multimodel averaged, annual mean rainfall anomalies (in mm/day) between future and past (2031–2060 in the RCP8.5 scenario and 1960–1990 in the Historical scenario), averaged over eight climate models. Field values are the anomalies in the raw model output (regridded to 1° resolution). Filled circles are anomalies in the bias‐corrected output. The boxes indicate the sites of West Sahel and Central Sahel. Bottom: Smoothed daily anomalies in rainfall (mm/day, green) and temperature (°C, red) averaged over the sites of (left) West and (right) Central Sahel. The solid line is the multi‐model mean, the shading represents 1 SD scatter (Reprinted with permission from Guan, Sultan, Biasutti, Baron, and Lobell (2017). Copyright 2017 Elsevier)
