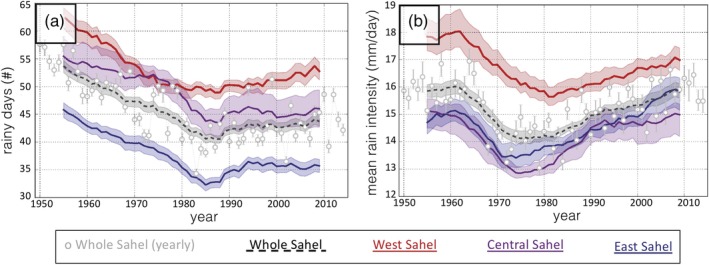
Figure 8.

Evolution of (a) the mean number of rainy days and (b) the mean intensity of rainy days (mm/day) over the whole Sahel and subdomains (West, Central, and East Sahel). Error bars (resp. shaded area) delineate 80% confidence intervals for annual values (resp. 11 year rolling mean) (Reprinted with permission from Panthou et al. (2018). Copyright 2018 the Creative Commons Attribution 3.0 license)
