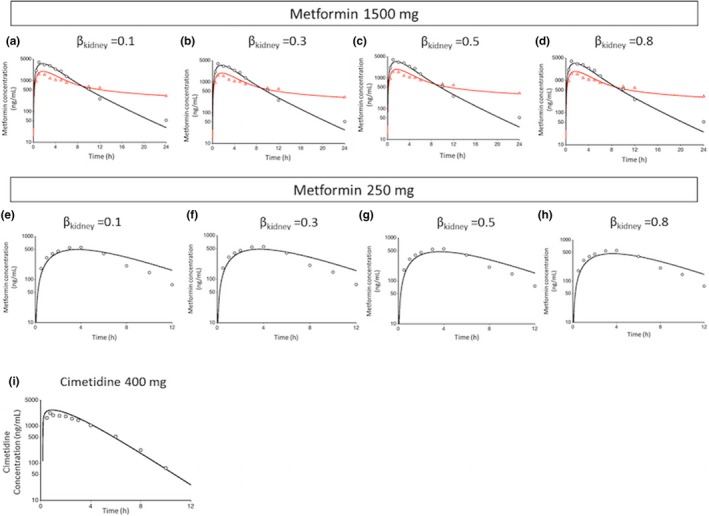
Figure 2.

Fitted and observed metformin plasma and blood concentration‐time profiles after single oral administration of 1,500 mg metformin (a–d), fitted and observed plasma concentration‐time profiles after a single oral administration of 250 mg metformin (e–h) and after a single oral administration of 400 mg cimetidine (i). The black circles and red triangles represent the observed concentration‐time profiles in plasma and blood, respectively. The black and red lines represent the fitted concentration‐time profiles in plasma and blood, respectively. Simulations were performed using differing βkidney values; βkidney = PSurine/(PSr,eff+PSurine).
