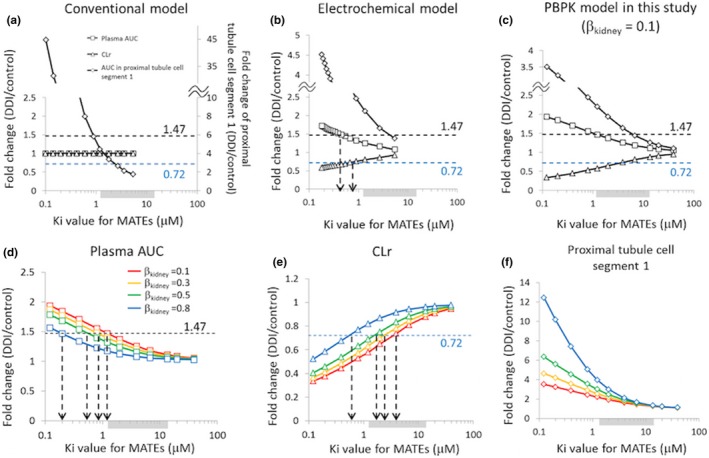
Figure 4.

Sensitivity analysis to examine the impact of changing Ki values for MATEs on the fold changes in plasma AUC (□), CLr (△), or AUC in the proximal tubule cell segment 1 (♢). For comparison, the initial analysis was performed using the conventional model (a) and the electrochemical model (b) reported by Burt et al.1 and our current PBPK model (c) using βkidney = 0.1. For our current PBPK model, the impact of changing βkidney values was examined on plasma AUC (d), CLr (e), and AUC in the proximal tubule cell segment 1 (f). The shaded area near the x‐axis indicates the range of in vitro Ki values for MATEs reported in the literature (geometric mean: 3.93 μM (1.22–13.5 μM)). The dotted horizontal lines indicate the observed fold changes in plasma AUC (1.47, black) or CLr (0.72, blue). (d–f) Red, orange, green, and blue symbols and lines represent the simulation results using optimized values shown in Table 1 for βkidney values of 0.1, 0.3, 0.5, and 0.8, respectively. DDI, drug–drug interaction; Ki, inhibition constant; MATEs, multidrug and toxin extrusion proteins; PBPK, physiologically‐based pharmacokinetic. AUC, area under the curve; CLr, renal clearance; βkidney = PSurine/(PSr,eff+PSurine).
