. 2019 Jun 11;8(6):380–395. doi: 10.1002/psp4.12426

Figure 3.

Figure 3

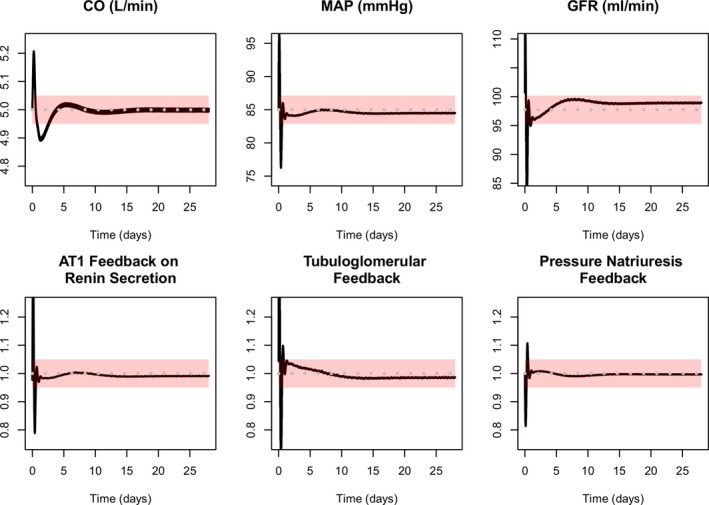
Examples of automated checks of baseline model behavior. Each time the model is updated, a validation script is run and visualizations are produced to facilitate convenient verification of appropriate model behavior. In this example, all variables should settle to values within the pink bands, and a result falling outside these ranges indicate a problem with the model update. Black lines = simulations. Gray dashed line = setpoints. Pink bars = acceptable ranges. Top row shows cardiac output (CO), mean arterial pressure (MAP), and glomerular filtration rate (GFR) all settle near their setpoint, within the acceptable range. Bottom row shows key feedback mechanisms are close to 1 (no effect), confirming that the variables in the top row are not being forced to their setpoints by extreme feedback values. Angiotensin II receptor type 1 (AT1)