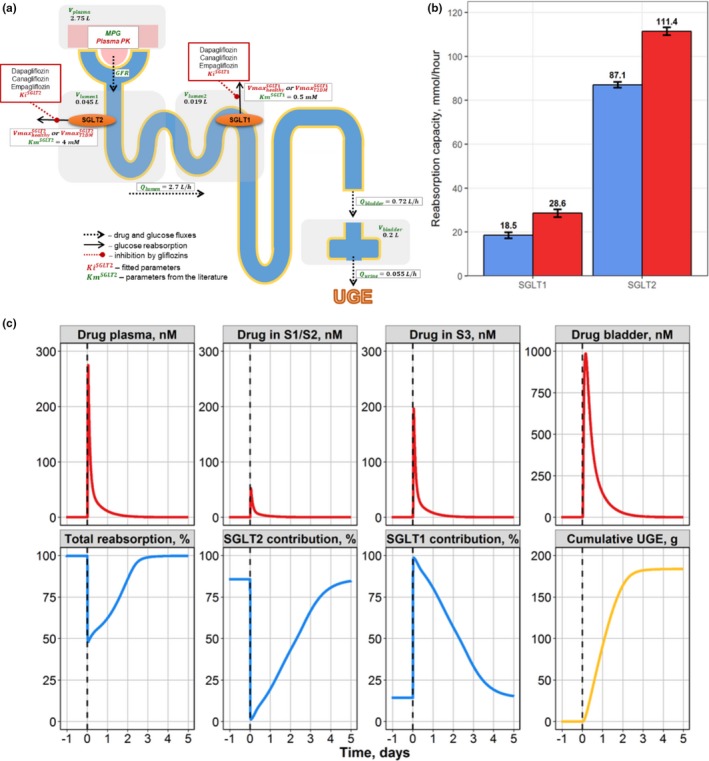
Figure 4.

Case study 2. (a) Schematic of drug‐disease quantitative systems pharmacology model for glucose filtration, reabsorption, and excretion. (b) Model‐predicted maximal SGLT1/2 contribution to glucose reabsorption in healthy (blue) and T2DM subjects (red). (c) Compensatory response of the SGLT1 transporter during SGLT2 inhibition by a single 10‐mg dose of dapagliflozin in T2DM subjects. Model simulations of dapagliflozin concentration time profiles in plasma, S1/S2, and S3 proximal tubule segments and bladder, with total reabsorption rate and contributions from each of the SGLT1 and SGLT2 transporters toward renal reabsorption and cumulative urinary glucose. UGE, urinary glucose excretion. T2DM – type 2 diabetes mellitus; S1/S2 denotes 1st and 2nd segments of the proximal tubule respectively; S3 denotes 3rd segment of the proximal tubule; SGLT1 – sodium‐dependent glucose cotransporter 1; SGLT2 – sodium‐dependent glucose cotransporter 2; MPG denotes mean glucose concentration in plasma; GFR – glomerular filtration rate; – urine formation flow; – physiological flux for distal tubules; – physiological flux for proximal tubules; – bladder volume; – plasma volume; – volume of segments of the kidney proximal tubule; reflects the maximum rate of renal glucose reabsorption through an SGLT transporter; Ki are inhibition constants for gliflozins; Km denotes Michaelis constant of glucose affinity
