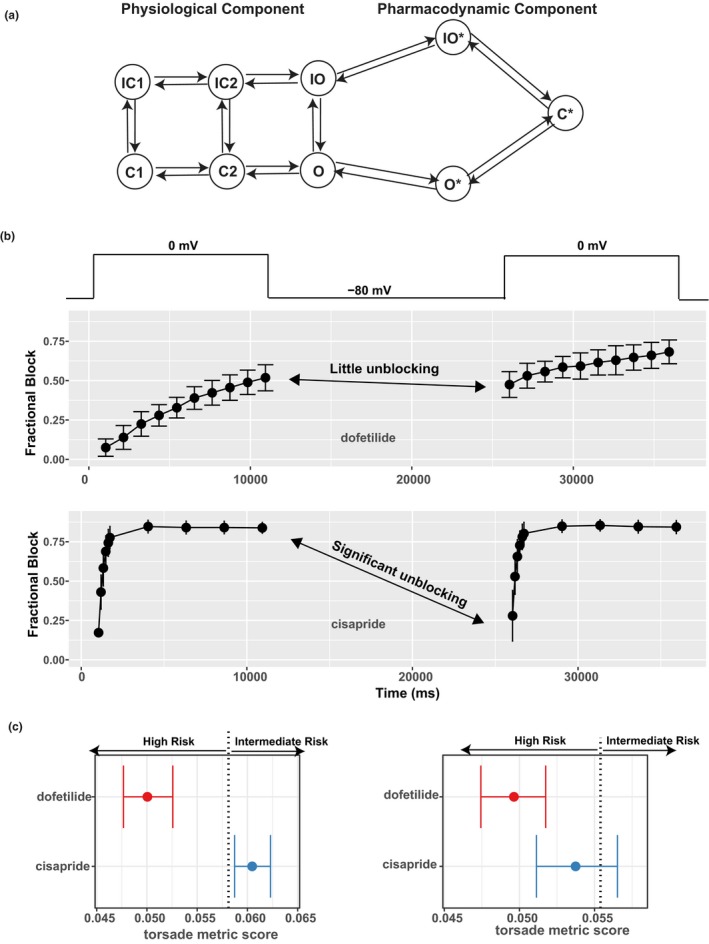
Figure 2.

The pharmacodynamic submodel of drug–human ether‐à‐go‐go related gene (hERG) dynamic interaction and its impact on risk prediction. (a) A diagram of the hERG submodel describing the channel‐gating (physiological component) and drug‐binding (pharmacodynamic component) processes of the hERG–drug interaction. Each node represents a distinct state (conformation) of the channel. States with an asterisk indicate drug‐bound states, whereas those without are drug‐free channel states. O, open state; C, closed state; IO, inactivated open state; IC, inactivated closed state; O*, open‐bound state; IO*, inactivated open‐bound state; C*, closed‐bound state. Note that there are two inactivated closed (IC) and closed (C) states, and they are distinguished by a numeric suffix (such as IC1, IC2 for the two IC states). (b) Using a dynamic voltage protocol to manifest the different binding kinetics of two selective hERG blockers, dofetilide (at 30 nM) and cisapride (at 300 nM). The voltage protocol is briefly shown in the top panel as voltage steps alternating between −80 and 0 mV. For the main panels, x‐axis is the time in milliseconds (ms) after the protocol was applied to the cell. y‐axis is fractional block 1 − I drug/I control, where I drug is the measured hERG current after drug application, and I control is the hERG current without drug. During the 0 mV steps, the channel is accumulated in the open state, and the binding/blocking process (O → O* → C*) in a takes place and can be measured as the development of fractional block. During the −80 mV step, the unbinding/unblocking process (C* → O* → O) takes place, and some blocking effect can be relieved. Dofetilide tends to be “trapped” in the C* state, resulting in little unblocking during the −80 mV step (fractional block changed little as shown by the double‐headed arrow). Cisapride has less tendency to be trapped, resulting in significant unblocking during the −80 mV step (fractional block decreased a lot as shown by the double‐headed arrow). Note that only two 0 mV steps are shown, but the actual protocol contains 10 such steps. (c) The use of the hERG‐binding kinetic information, but not half‐inhibition concentrations (IC50s), can distinguish different torsade de pointes risk liabilities associated with dofetilide and cisapride. Left: The hERG‐binding submodel in a was parameterized by the full data obtained from the dynamic protocol in b across multiple concentrations and then used within the O'Hara Rudy model to calculate the torsade metric scores (qNet values averaged across 1×, 2×, 3×, and 4× maximum free therapeutic plasma concentration (Cmax)).34 The torsade metric scores for the 12 training drugs were used by ordinal logistic regression to determine the classification thresholds. One of the thresholds (value 0.058 as published in ref. 36) that separates high risk from intermediate risk is shown as a vertical dotted line. Dofetilide and cisapride are correctly classified on the left and right of this threshold, respectively. Right: The same practice as on the left but IC50s, instead of hERG‐binding kinetics, were used within the O'Hara Rudy model to calculate the torsade metric scores. The hERG IC50s were calculated using the fractional block at the last timepoint of the dynamic protocol across multiple concentrations in b. The vertical dotted line is the classification threshold determined the same way as on the left panel, the only difference being the use of IC50s instead of binding kinetics within the model. Under this situation without considering the binding kinetics, dofetilide and cisapride both have most of their score distributions in the high‐risk category. Note that the prediction in left, but not right, is consistent with the Comprehensive In Vitro Proarrhythmia Assay (CiPA) risk categories.
