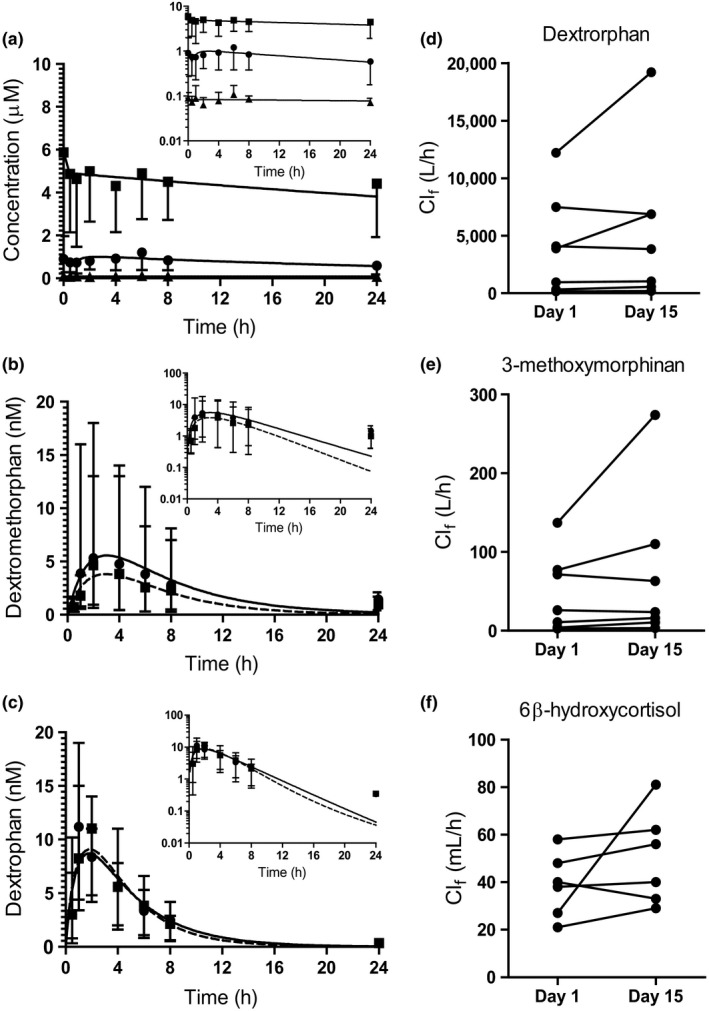
Figure 4.

Serum concentration‐time profiles of the study drugs and the pharmacokinetic measures of CYP2D6 and CYP3A4 activity markers. Panel (a) shows the serum concentration vs. time profiles for 13‐cis‐retinoic acid (13cis RA) (circles) and its metabolites 4‐oxo‐13cis RA (squares), and all‐trans‐retinoic acid (at RA) (triangles) following the final 40 mg dose of 13cis RA on study day 15. Panels (b,c) show the serum concentrations of dextromethorphan (b) and dextrorphan (c) on study days 1 (prior to 13cis RA dosing, circle with solid line) and 15 (after 13cis RA dosing, square with dashed line). Concentration data are presented as mean and range of individual values (n = 8). Insets are data presented on semilog scale. The calculated formation clearances (Clf) of dextromethorphan metabolites dextrorphan (d) and 3‐methoxymorphinan (e) on the two study days are shown for seven subjects. One subject was identified as an outlier and removed from all analyses involving urine data. Panel (f) shows 6β‐hydroxycortisol Clf on the two study days in six subjects. One subject had no measurable 6β‐hydroxycortisol in urine collected from study day 15 and was excluded.
