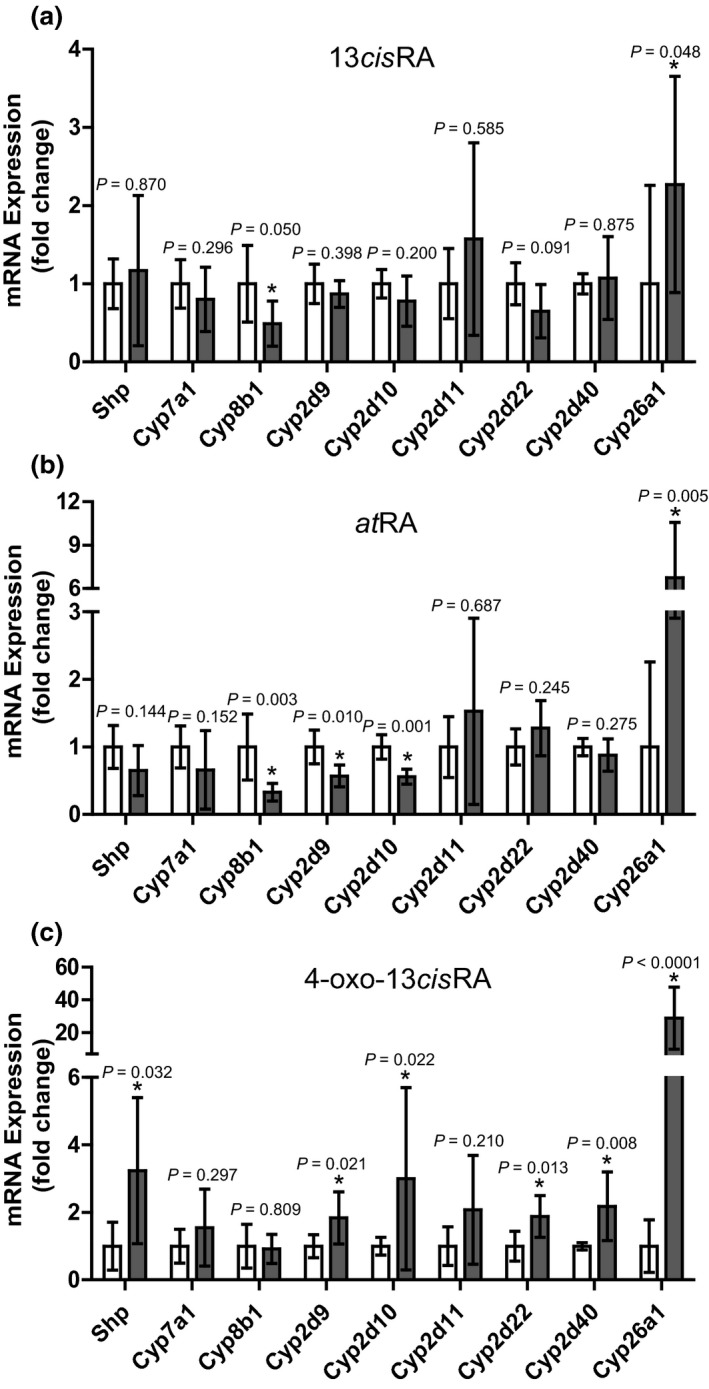
Figure 5.

Effects of 13‐cis‐retinoic acid (13cis RA), all‐trans‐retinoic acid (at RA), or 4‐oxo‐13cis RA on cytochrome P450 (CYP) mRNA expression in mouse livers following treatment with each study retinoid. The mice (n = 6 for each treatment) were treated for 4 days with each retinoid at 5 mg/kg i.p. as described in the Methods section and the fold change in small heterodimer partner (Shp) and Cyp mRNA expression (black bars) was evaluated in comparison to vehicle controls (white bars). The panels show mRNA data after treatment with 13cis RA (a), at RA (b), or 4‐oxo‐13cis RA (c), and the insets provide P values calculated for each gene compared to control as described in methods. *P < 0.05.
