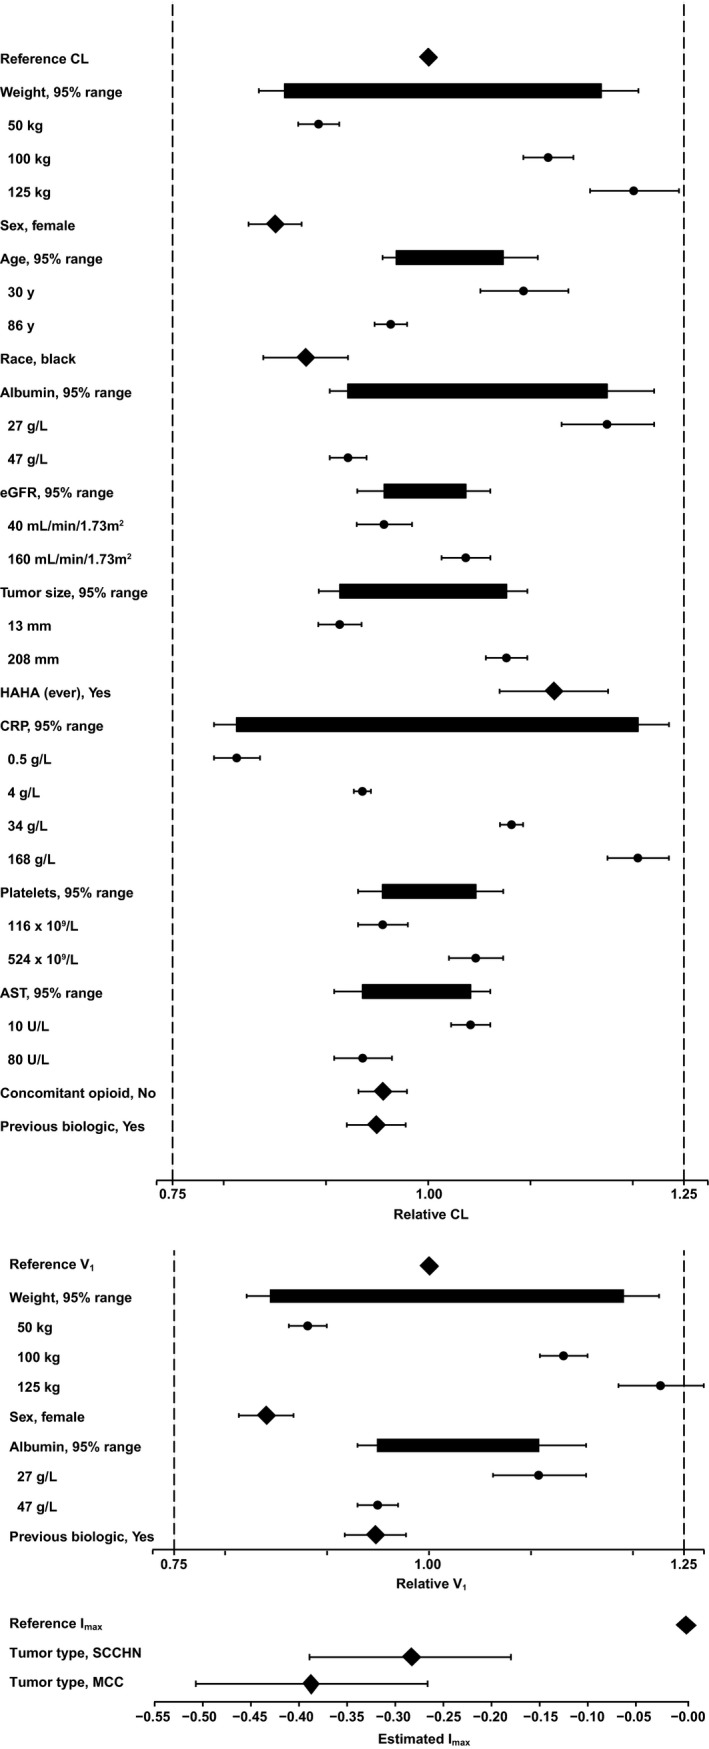
Figure 1.

Forest plots illustrating the effects of covariates in the final reduced model. AST, aspartate transaminase; CL, clearance; CRP, C‐reactive protein; eGFR, estimated glomerular filtration rate; HAHA, human anti‐human antibody; Imax, maximal change in CL relative to baseline; MCC, Merkel cell carcinoma; SCCHN, squamous cell carcinoma of the head and neck; V1, central volume of distribution.
