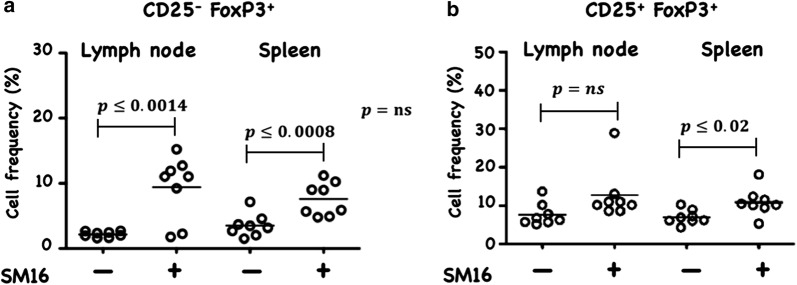
Fig. 3.
Frequency of CD25−FoxP3+ and CD25+FoxP3+ (Treg) cells, respectively among CD4+ cells isolated from lymph node and spleen. Naive FoxP3eGFP mice were maintained for 14 days on control or SM16 diet. Subsequently, mice were sacrificed, and lymph node and spleen were isolated to perform flow cytometry analysis. Frequency of CD25−FoxP3+ (a) and CD25+FoxP3+ Tregs (b) cells. Data presented are mean values from eight animals in 2 independent experiments. Significance between control and experimental groups were determined by Student’s t-test

