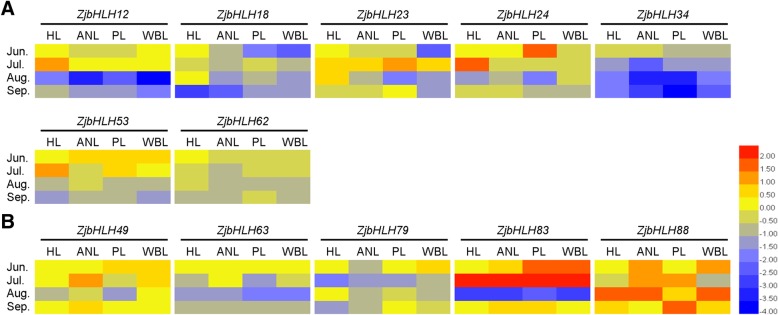
Fig. 8.
Heat maps of the relative expression of ZjbHLH genes under phytoplasma stress. a The gene expression in diseased leaves was significantly lower than that in healthy leaves. b The gene expression in diseased leaves was significantly higher than that in healthy leaves. Scaled log2 expression values based on qRT-PCR data are shown from blue to red, indicating low to high expression, respectively

