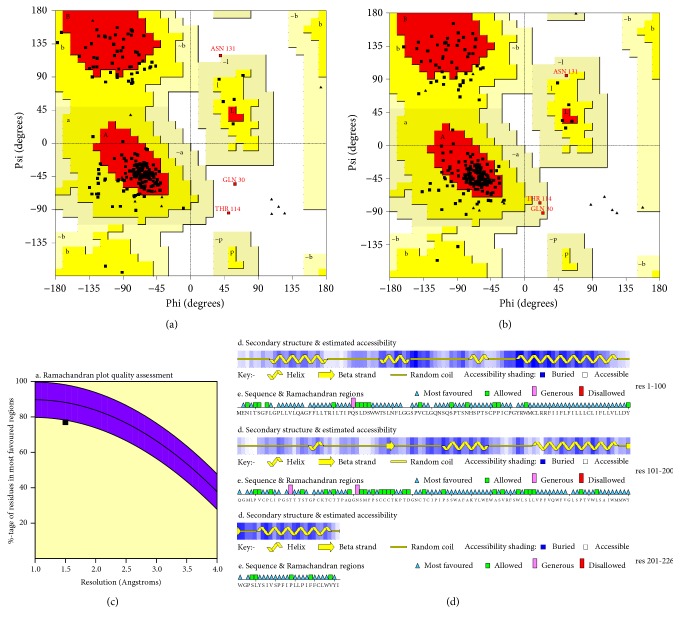
Figure 1.
HBs antigen Ramachandran plot generated using PROCHECK web server before (a) and after 20 ns MD (b). A, B, and L: most favoured regions; a, b, l, and p: additional allowed regions; ~a, ~b, ~l, and ~p: generously allowed regions; white areas are the disallowed regions. Glycine residues are shown in triangle. (c) represents percentage of residues that are most favoured in the Ramachandran plot of minimized HBsAg structure which is 77% at 1.5Å resolution. (d) shows the secondary structure formation, where the “a” determinant region (a.a 99-169) majorly consists of random coil structure. After 20 ns MD, out of 226 amino acids there are no amino acids located in the disallowed region while only Q30, T114, and N131 amino acids are in the generously allowed region.

