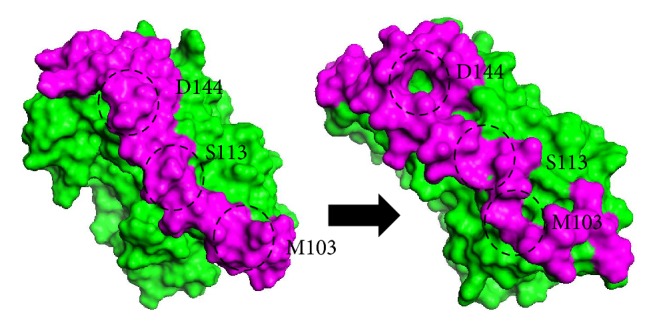
Figure 2.

Three-dimensional structure of HBsAg before (left) and after 20 ns MD simulation (right). Magenta colour shows the epitope region of HBsAg which undergoes an obvious conformational change after the whole course of simulation. The formation of anchor-like binding sites along the epitope suggests the location of aptamer binding.
