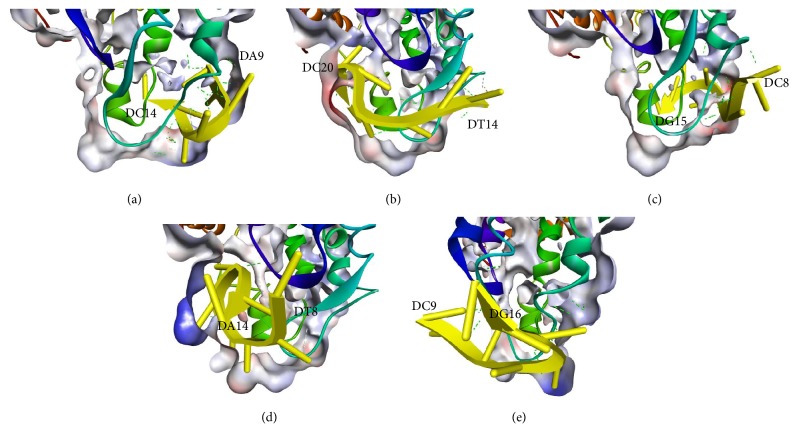
Figure 5.
Illustrations of the representative aptamers poses (a) H01a, (b) H01b, (c) H02a, (d) H02b, and (e) H03a (all in yellow) obtained after docking to HBsAg. One part of “a” determinant region is shown in turquoise, where most of the aptamer docking occurred. Intermolecular polar contacts are shown as dashed lines.

