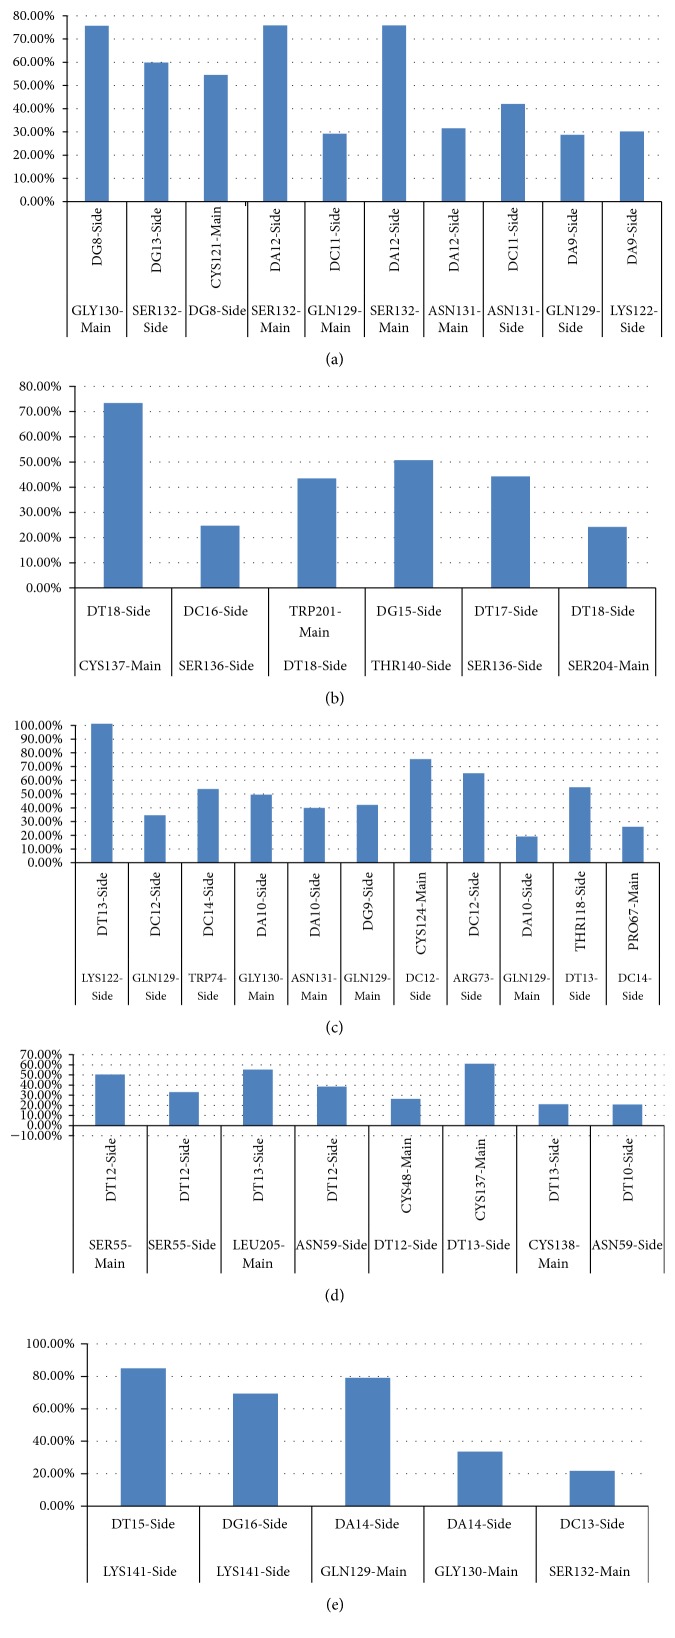
Figure 7.
Histogram of intramolecular hydrogen bonds with occupancy percentage higher than 20% for each complex: (a) H01a, (b) H01b, (c) H02a, (d) H02b, and (e) H03a. Electron acceptors are on the top of x-axis while electron donors are at the bottom. H02a shows the highest number of aptamer-HBsAg intramolecular polar interactions, and its DT13 and Lys122 hydrogen bonds are the most stable as they exist for the whole 20 ns (100%).

