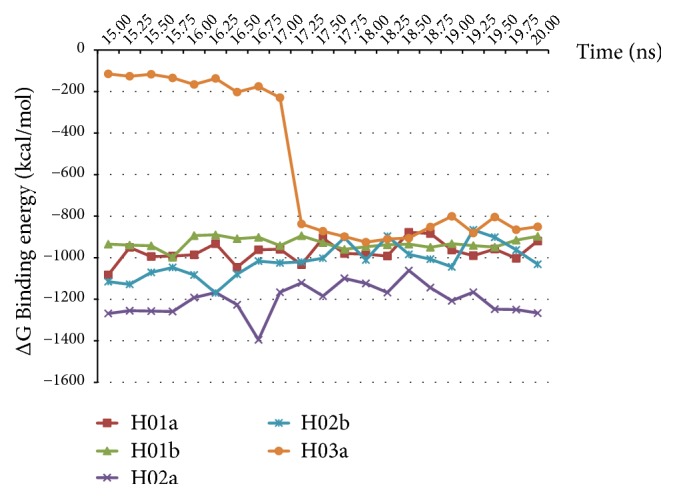
Figure 8.

Total energy binding value for the last 5 ns of simulation (15-20 ns) as per calculated using the MMPBSA method. H02a shows the lowest total energy binding value which translated to the highest affinity towards HBsAg, while H03a gives highest total binding energy and less binding affinity towards HBsAg compared to other aptamers.
