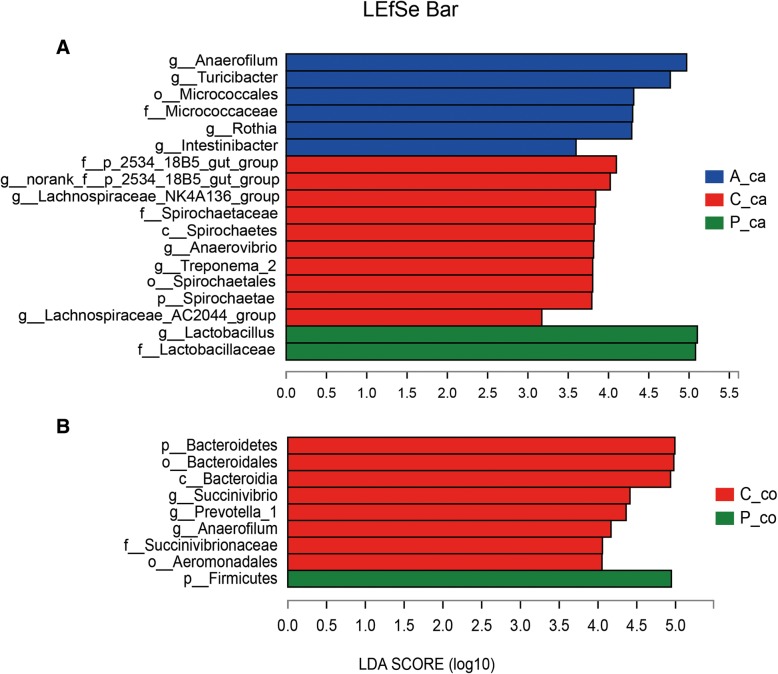
Fig. 4.
Linear discriminant analysis effect size (LEfSe) analysis microbiota in the caecal and colonic chyme of weaned pigs from phylum to genus levels. The linear discriminant analysis (LDA) plots indicate species that can be used as biomarkers, which was determined by ranking them according to their effect size. Different colors represent different groups. (a) LDA analysis of the caecum microbial. C_ca (caecal samples of control group), red bars; A_ca (caecal samples of antibiotic group), blue bars; P_ca (caecal samples of probiotics group), green bars. (b) LDA analysis of the colonic microbial. C_co (colonic samples of control group), red bars; P_co (colonic samples of probiotics group), green bars

