Fig. 4.

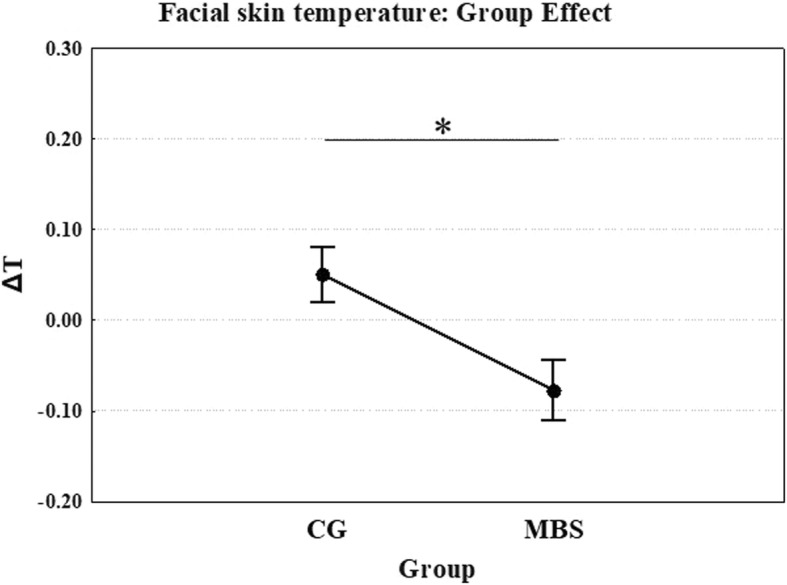
Experiment 2: Mean temperature as a function of group (children with MBS and control group, CG) in all ROIs. *p < 0.05. Error bars represent SE (standard errors of the means)

Experiment 2: Mean temperature as a function of group (children with MBS and control group, CG) in all ROIs. *p < 0.05. Error bars represent SE (standard errors of the means)