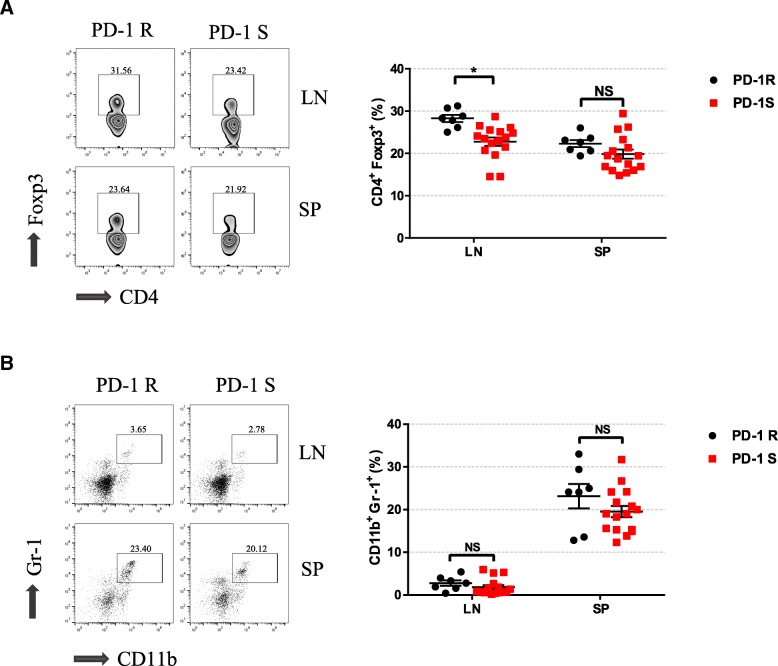
Fig. 4.
Relative distributions of key immunosuppressive cells after the anti-PD-1 antibody treatment. a, b Flow cytometry analysis was performed to characterize and quantify Tregs (CD4+Foxp3+) and MDSCs (CD11b+Gr-1+). Compared to the PD-1S group, the PD-1R group exhibited an increase in Treg accumulation. All data represent the mean ± SEM. Statistical significance was determined by Student’s t test, *P < 0.05. Tregs, regulatory T cells; MDSCs, myeloid-derived suppressor cells

