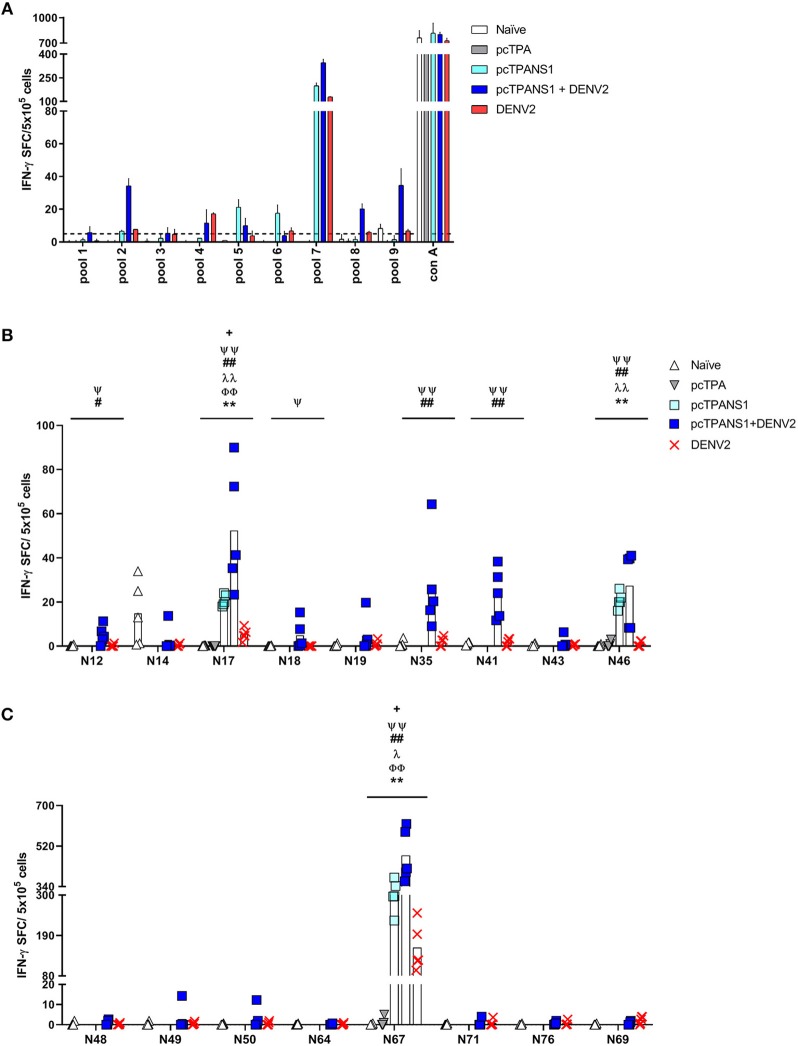
Figure 3.
T cell NS1-derived peptide identification in pcTPANS1-immunized BALB/c mice by IFN-γ ELISPOT assays. Immunizations, virus challenge and euthanasia were outlined in Figure 2A. Splenocytes isolated from pcTPANS1-immunized BALB/c mice (n = 3, pooled), challenged or not with DENV2, were stimulated with NS1-derived peptides for 18 h, and the number of cells producing IFN-γ was measured by ELISPOT assay. Peptides and cells were evaluated in pools (A) and positive peptides were confirmed by tests performed with cells from individual mice (n = 5) (B,C). ELISPOT assays were performed using splenocytes collected 15 days following DNA inoculation (gray and light blue bars/dots) or 21 (A) and 7 days post-infection (B,C) (dark blue bars/dots). Cells from naïve or pcTPA-inoculated mice were used as negative controls. The horizontal dotted lines represent the cut-off selection point (≥5 SFC/5 × 105 cells) (B,C). Bars represent the mean plus standard deviation of triplicate data in (A) and the means of each group in (B,C). Symbols represent significant differences between groups, using non-parametric two-tailed Mann-Whitney statistical tests: * pcTPA- vs. pcTPANS1-inoculated mice; # naïve animals vs. pcTPANS1-immunized mice after DENV2 challenge; + pcTPANS1-immunized mice vs. pcTPANS1-immunized animals after DENV2 challenge; Φ naïve animals vs. DENV2 challenged mice; λ pcTPANS1-immunized mice vs. DENV2 challenged animals; Ψ pcTPANS1-immunized animals challenged with DENV2 vs. DENV2 challenged mice. One symbol: p < 0.05; two symbols: p < 0.001; three symbols: p < 0.0001.

