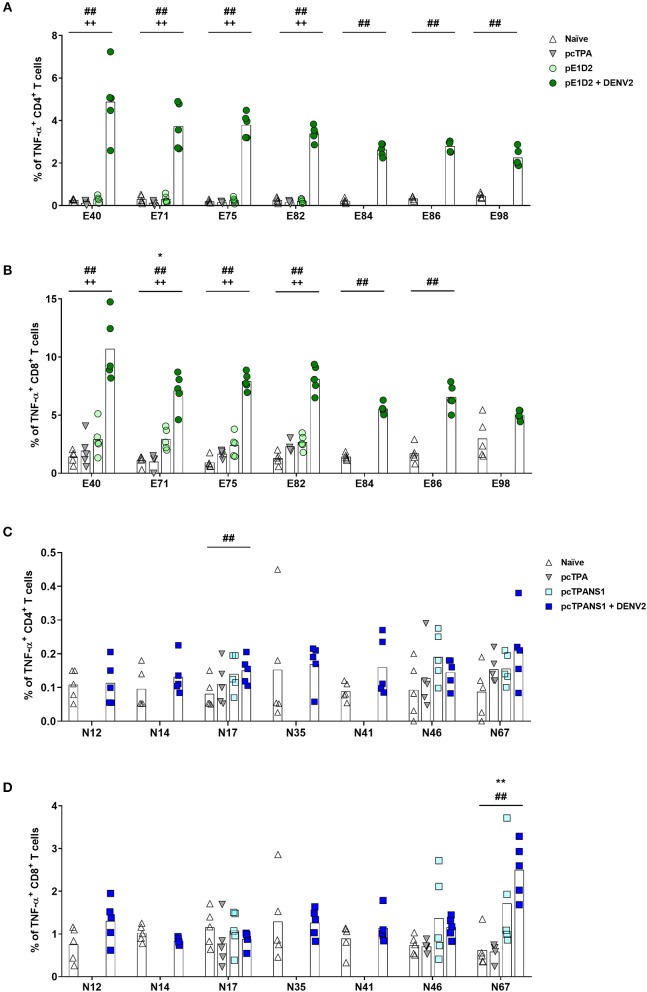
Figure 5.
Frequencies of TNF-α-producing T cells after stimulation with E- or NS1-derived peptides by ICS assays. Immunizations, virus challenge, and euthanasia were outlined in Figure 2A. Splenocytes isolated from BALB/c mice immunized with pE1D2 or pcTPANS1 (n = 5), challenged or not with DENV2, were stimulated with E- (A,B) or NS1-derived peptides (C,D) for 6 h and TNF-α production was detected by ICS assay. Peptides were selected according to previous ELISPOT results, and splenocytes were harvested following DNA inoculation or 7 days post infection. Numbers indicate CD4+ (A,C) or CD8+ T cells (B,D) producing TNF-α as a percentage of total splenocytes. Cells from naïve or pcTPA-inoculated mice were used as negative controls. Bars represent the means of each group. Symbols represent significant differences between groups, using non-parametric two-tailed Mann-Whitney statistical tests: * pcTPA- vs. pE1D2- or pcTPANS1-inoculated mice; # naïve animals vs. pE1D2- or pcTPANS1-immunized mice after DENV2 challenge; + pE1D2- or pcTPANS1-immunized mice vs. pE1D2- or pcTPANS1-immunized animals after DENV2 challenge. One symbol: p < 0.05; two symbols: p < 0.001; three symbols: p < 0.0001.

