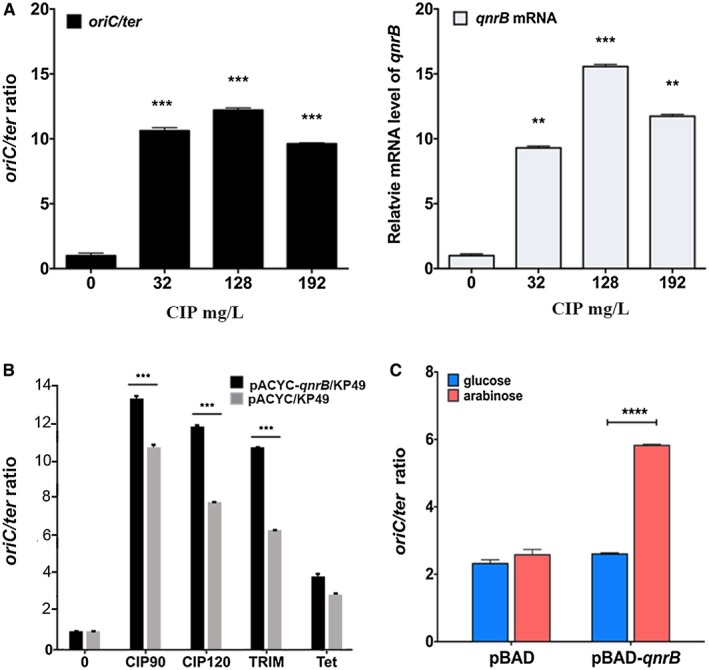
Figure 3.

QnrB increases DNA replication stress. A. CIP induces replication stress (oriC/ter ratio; left panel) and qnrB mRNA expression (right panel) in a concentration‐dependent manner. The K. pneumoniae KP48 strain harboring a plasmid expressing QnrB was treated with or without CIP (0, 32, 128 or 192 mg/l) for 90 min. The oriC/ter ratio and qnrB mRNA level were measured using real‐time quantitative PCR. Data are shown as the mean ± SD of three replicates. A significant difference in the oriC/ter ratio was observed between the strain with CIP and the strain without CIP (two‐sided Student’s t‐test, ** p < 0.01, *** p < 0.001). The data shown are representative of three independent experiments. B. TRIM induces replication stress. The K. pneumoniae KP48 and KP49strains were treated with or without CIP (128 mg/l), TRIM (0.7 mg/l) or tetracycline (Tet; 1 mg/l) for approximately 90 min at 37°C. The oriC/ter ratio was determined by real‐time quantitative PCR. Data are shown as the mean ± SD of three replicates. A significant difference in mRNA was observed between mRNA of the strain expressing QnrB and the strain lacking QnrB (two‐sided Student’s t‐test. *** p < 0.001). The data shown are representative of three independent experiments. TRIM, trimethoprim; Tet, tetracycline. C. Overexpression of QnrB induces DNA replication stress in E. coli. Induction of E. coli BW25113 cells harboring pBAD‐qnrB or pBAD was performed at an OD600 of 0.3 by adding arabinose (0.5% w/v; red column). An untreated culture served as the negative control (blue column). The cells were harvested 40 min after treatment. Replication stress (oriC/ter ratio) was measured by real‐time quantitative PCR. Data are shown as the mean ± SD of three replicates. A significant difference in the oriC/ter ratio was observed between the strain expressing QnrB and the strain lacking QnrB (two‐sided Student’s t‐test. **** p < 0.0001). The data shown are representative of five independent experiments. [Colour figure can be viewed at wileyonlinelibrary.com]
