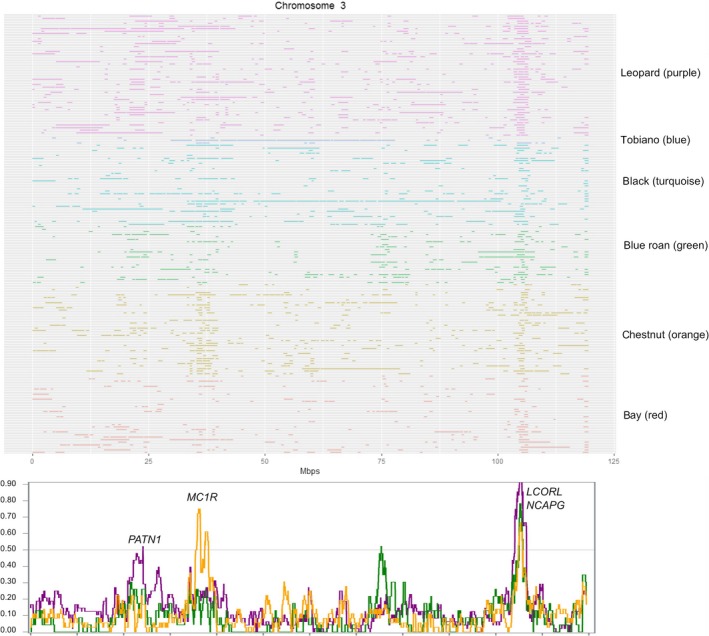
Figure 4.

Distribution of runs of homozygosity (ROH) on ECA3 per individual. Line colors indicate coat color of horses (purple = leopard spotted, blue = tobiano, turquoise = black, green = roan, orange = chestnut, red = bay). In the line plot below, the frequencies of animals sharing a ROH are illustrated (purple = leopard spotted, green = roan, orange = chestnut).
