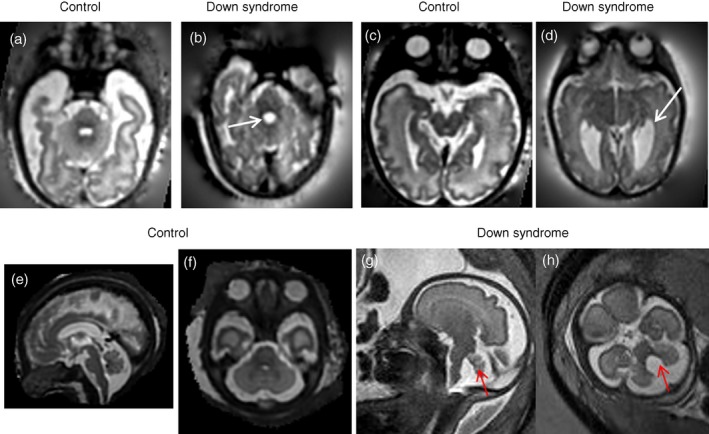
Figure 5.

T2‐weighted fetal magnetic resonance imaging in a control fetus and a fetus with Down syndrome. T2‐weighted axial images showing the fourth (a,b) and lateral ventricle (c,d) in control (34+1 GA; a,c) and fetus with Down syndrome (33+2 GA; b,d). White arrows indicate enlarged fourth and lateral ventricles in a fetus with Down syndrome. T2‐weighted sagittal (e,g) and axial (f,h) images in a fetus with Down syndrome (30wks GA, g,h) compared to an age matched control (30wks GA, e,f). Red arrow indicates cerebellar vermis rotation (g) and fourth ventricle enlargement (h). GA, gestational age expressed as weeks+days. [Colour figure can be viewed at wileyonlinelibrary.com]
