Figure 1.

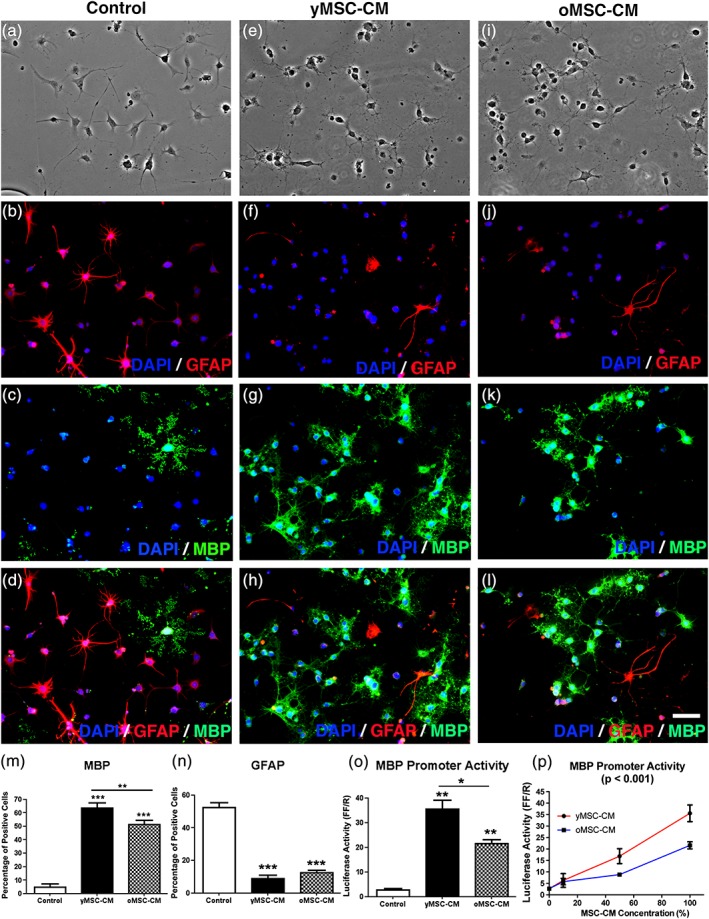
Aged MSCs display a reduced ability to promote the generation of oligodendrocytes from NSCs. NSCs were incubated in control medium (αMEM‐10%FBS, a–d) and MSC‐CM derived from young MSCs (yMSC‐CM, e–h) or old MSCs (oMSC‐CM, i–l) for 1 week. Phase contrast images show NSCs morphology after the different treatments (a, e, i). Fluorescent images indicate NSCs expression of GFAP (b, f, j), MBP (c, g, k), and the merge (d, h, l). DAPI nuclear staining is shown in all fluorescent images. (a–l) Scale bar = 50 μm. Quantitative analysis shows the percentage of MBP‐expressing cells (m) and GFAP‐expressing cells (n) for all conditions tested. Note that although both yMSC‐CM and oMSC‐CM induce an increase in the proportion of MBP‐expressing cells and a decrease in GFAP‐expressing cells with respect to control. However, yMSC‐CM displays a higher effect on MBP‐positive cells than oMSC‐CM. Values are displayed as mean ± SD. Experiment was performed in tetraplicate. One‐way ANOVA and the Tukey post hoc test were used for statistical analysis. **p < .01; *** p < .001. NSCs were transfected with MBP promoter‐Luci vector and incubated for 3 days under control medium, yMSC‐CM and oMSC‐CM. Cells were also exposed for 3 days to different MSC‐CM dilutions. Quantification of bioluminescence data shows MBP promoter activation (as luciferase activity) in NSCs either treated in the conditions previously mentioned (o) or treated with increasing doses of yMSC‐CM and oMSC‐CM (p). Note that although both yMSC‐CM and oMSC‐CM induce an increase of the MBP promoter activity with respect to control, yMSC‐CM displays a higher effect than oMSC‐CM. Values are displayed as mean ± SD. Experiment was performed in triplicate. One‐way ANOVA and the Tukey post hoc test as well as two‐way ANOVA (p) were used for statistical analysis. *p < .05; **p < .01 (o) and p values given in graph title indicate a significant difference between MSC‐CM ages (p)
