
Figure 4.
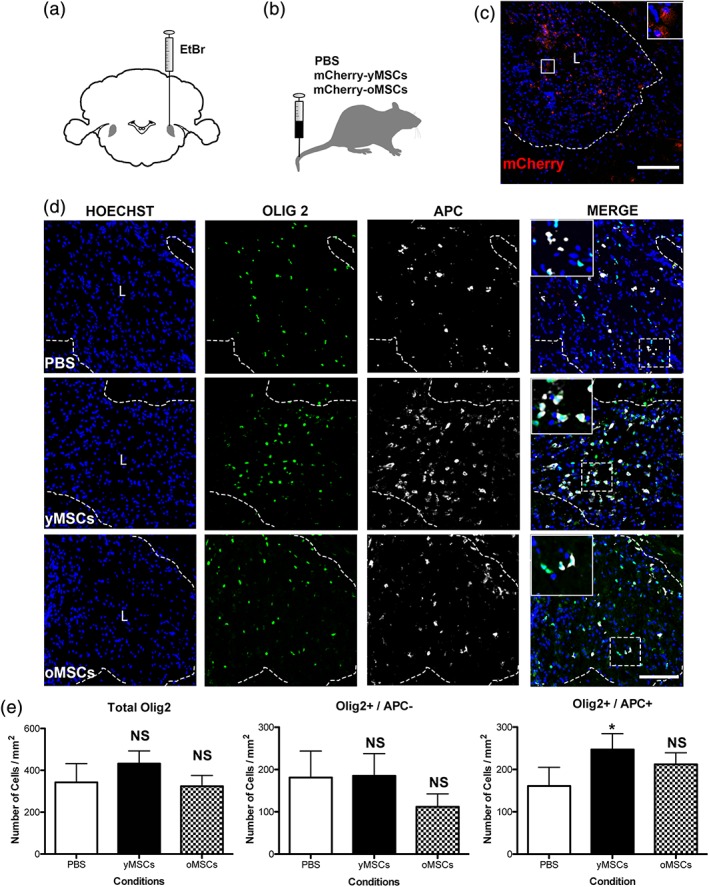
Only transplanted MSCs derived from young donors boost OPC differentiation during CNS remyelination. Twelve months old rats were demyelinated by ethidium bromide (EtBr) injection into the caudal cerebellar peduncle (a). One, two, and three days after demyelination, rats were systemically transplanted with yMSCs or oMSCs that express mCherry for their future detection (b). PBS is used as vehicle control. Fluorescent image shows the presence of mCherry‐expressing MSCs in the demyelinated area at 21 days post‐lesion (dpl) (c). Scale bar = 200 μm. Fluorescent images show the presence of OPCs (Olig2+/APC−) and the generation of new oligodendrocytes (Olig2+/APC+) in the lesion site of the different animal groups (d). Hoechst shows nuclei counterstaining. Dashed lines denote demyelinating lesion area (L). Scale bar = 100 μm. In merge images, the inset shows a magnification of the area delimited by the square. Quantitative analysis shows the number of all oligodendroglial lineage cells (Olig2+), OPCs, and differentiated oligodendrocytes within the demyelinated lesion area (mm2) of the distinct animal groups at 21 dpl (e). Note that only the animals that were transplanted with yMSCs display a higher number of differentiated oligodendrocytes (Olig2+/APC+) within the lesion site. Values are displayed as mean ± SD. Five animals were analyzed for the PBS group while four animals were analyzed for the group transplanted either with yMSCs or oMSCs. Statistics were performed by one‐way ANOVA and the Tukey post hoc test. *p < .05; NS, not significant