Figure 1.

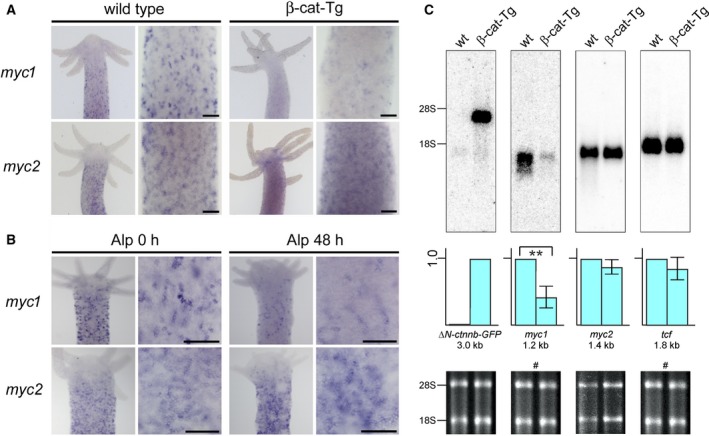
Specific repression of myc1 mRNA expression upon β‐Catenin activation. (A) Expression patterns of Hydra myc1 and myc2 in β‐Catenin transgenic animals (β‐cat‐Tg) compared to wild‐type polyps. Whole wild‐type and transgenic polyps have myc1 and myc2 expressed throughout their body columns, but not in head and foot structures. myc1 is downregulated in the transgenic polyps, whereas myc2 levels are not significantly changed. (B) Differential expression of Hydra myc1 and myc2 48 h after onset of treatment with the GSK‐3β inhibitor Alp. Inhibition of GSK‐3β results in activation of β‐Catenin in the canonical Wnt signaling pathway, and as a result in a reduction of the myc1 expression level. Upper halves of polyps and magnified views from gastric regions are shown. Bars in the magnified views represent 25 μm. (C) Northern analysis using aliquots (2.0 μg) of poly(A)+‐selected RNAs from whole wild‐type (wt) and transgenic Hydra animals, and Hydra myc1, myc2, or tcf‐specific cDNA probes derived from the relevant coding regions. Positions of residual ribosomal RNAs (28S, 18S) are given on the left site. Ethidium bromide‐stained RNAs used for blot analysis are shown below. The blot, which was hybridized to a second probe after filter washing is indicated by a hash sign (#). For transgenic mRNA detection, a GFP‐specific probe (ΔN‐ctnnb‐GFP) was applied (arbitrary expression level 1.0). Representative blots from three independent experiments are shown where myc1, myc2, and tcf levels from wild‐type animals were arbitrarily set to 1.0. Standard deviations (SD, n = 3) are shown by vertical bars. Statistical significance was assessed by using a paired Student t‐test (**P < 0.01).
