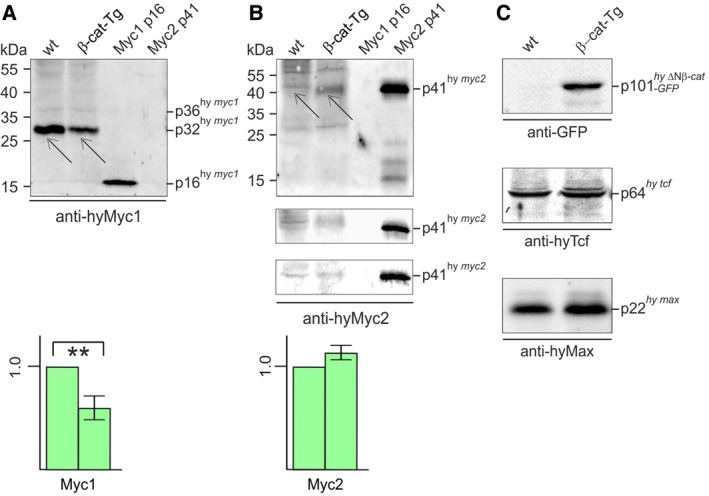
Figure 2.

Specific repression of Myc1 protein expression upon β‐Catenin activation. (A, B) Expression of Hydra Myc1 (A) and Myc2 (B) proteins in β‐catenin transgenic animals (β‐cat‐Tg) compared to wild‐type (wt) polyps. (C) Expression control of the transgenic fusion protein ΔN‐Ctnnb‐GFP, and of Hydra Tcf or Hydra Max in β‐cat‐Tg compared to wt polyps. Protein expression was tested by immunoblot analysis using each 10 μg of cell extract. Proteins were resolved by SDS/PAGE (10%, wt/vol) and detected using antibodies directed against recombinant Myc1, Myc2, Max, or Tcf proteins, or against the green fluorescent protein (GFP). As specificity control, each 10 ng of recombinant Myc1 p16 or full‐length Myc2 (p41) were used in panels A and B. Representative blots from three independent experiments are shown, where Myc1 and Myc2 levels from wild‐type animals were arbitrarily set to 1.0. Thin arrows depict the endogenous Hydra Myc1 or Myc2 protein bands. Standard deviations (SD, n = 3) are shown by vertical bars. Statistical significance was assessed by using a paired Student t‐test (**P < 0.01). In case of Myc2, which is hardly detectable by immunoblotting, all three blots used for quantification are shown (P = 0.08).
