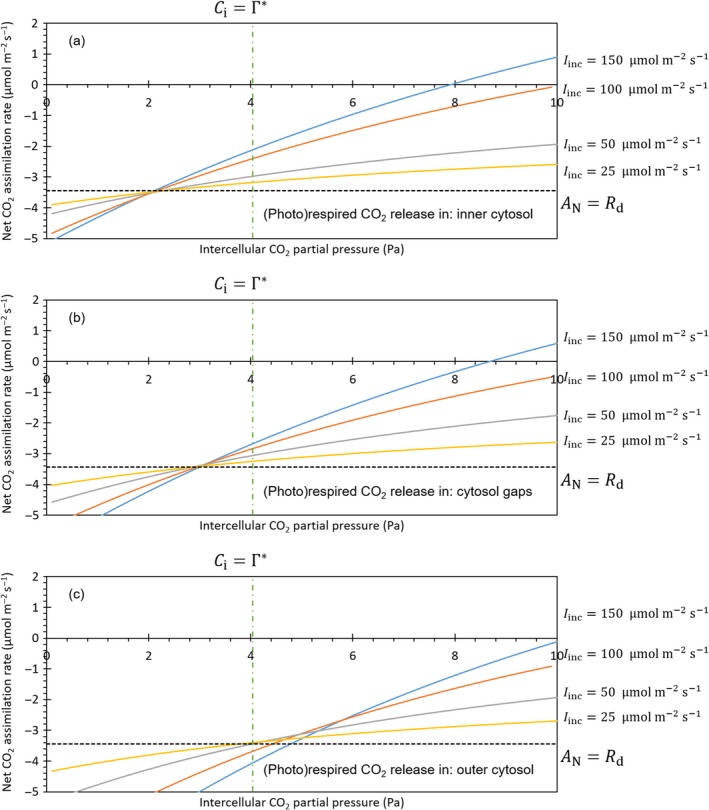
Figure 4.

Simulated response curve of the net CO 2 assimilation rate (A N) to intercellular CO 2 partial pressures (C i) under the conditions of the Laisk method for different scenarios of (photo)respired CO 2 release. The solid lines represent CO 2 response curves simulated at different irradiances I inc (150, 100, 50 and 25 μmol m−2 s−1). The dashed line represents the net CO 2 assimilation rate which equals the negative input value of the day respiration rate (R d). The dashed‐dotted line represents the intercellular partial pressure which equals the CO 2 compensation point (Γ*). (Photo)respired CO 2 is released either in the inner cytosol (a), the cytosol gaps (b) or the outer cytosol (c).
