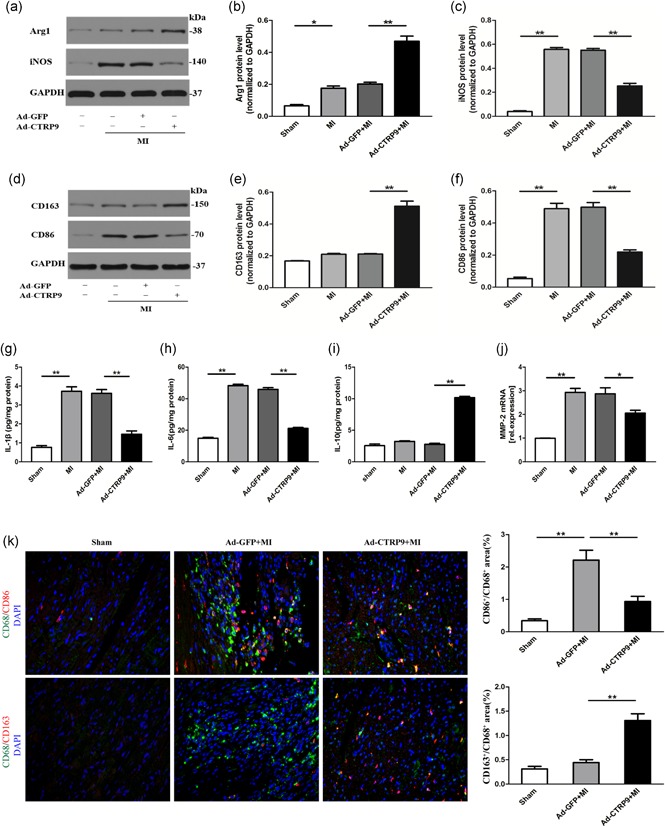
Figure 2.

Ad‐CTRP9 treatment enhances anti‐inflammatory effects and mediates M1 to M2 phenotype polarization in the infarct border zone at Day 3 post‐MI. Rats were treated with Ad‐CTRP9 as shown in the above illustration. (a–f) The effect of Ad‐CTRP9 on M1 (iNOS and CD86) and M2 (Arg1 and CD163) macrophage markers by western blot analysis. (g–i) The protein levels of IL‐1 β, IL‐6, and IL‐10 were measured by tissue ELISA. (j) The matrix metalloproteinase (MMP)‐2 mRNA levels were measured by PCR. (k, l) Representative fluorescent immunostaining images after merging (left, n = 4). The hearts were stained with CD68 (green), CD86/CD163 (red), and DAPI (blue). The double‐positive CD86 and CD68 (CD86+/CD68+) areas of M1 macrophages and CD163+/CD68+ M2 macrophages were quantified (right). Data are presented as the mean ± SEM from three independent experiments. *p < 0.05 and **p < 0.01, the connection represents a comparison between two groups. Arg1: arginase1; CTRP9: C1q/TNF‐related protein‐9; DAPI: 4′,6‐diamidino‐2‐phenylindole; ELISA: enzyme‐linked immunosorbent assay; GAPDH: glyceraldehyde 3‐phosphate dehydrogenase; iNOS: inducible nitric oxide synthase; MI: myocardial infarction; mRNA: messenger RNA; PCR: polymerase chain reaction; SEM: standard error of the mean [Color figure can be viewed at wileyonlinelibrary.com]
