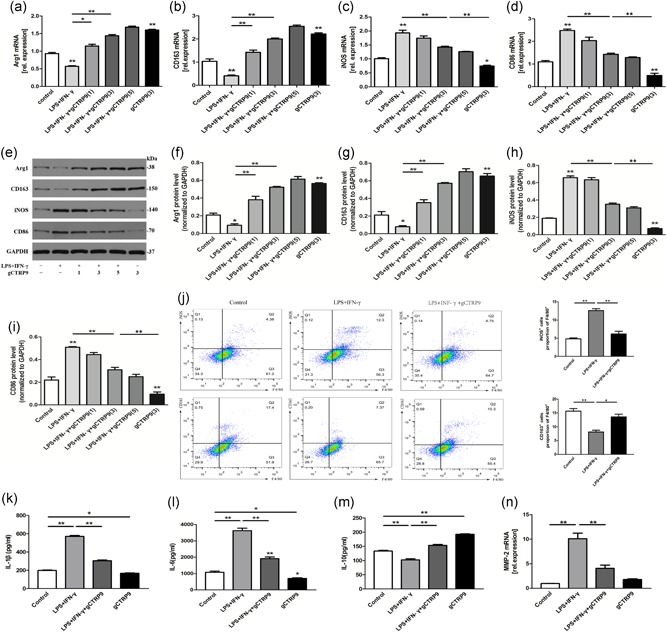
Figure 3.

CTRP9 promotes M2 macrophage polarization and decreases inflammatory cytokine production in vitro. Peritoneal macrophages (1 × 10⁶ cells/ml per well) were preincubated with different concentrations of gCTRP9 (1, 3, and 5 μg/ml) for 30 min. After stimulation with 100 ng/ml LPS + 20 ng/ml IFN‐γ or treatment with PBS for 24 hr, the cells were collected. (a–i) Representative mRNA (upper panel) and protein (lower panel) expression of specific M1 and M2 markers were evaluated by qRT‐PCR and western blot analyses. (j) Flow cytometry analysis (left) with quantification (right) of iNOS+/F4/80+ and CD163+/F4/80+ macrophages in total macrophages. (k–m) The supernatant protein levels of IL‐1β, IL‐6, and IL‐10 were measured by ELISA. (n) PCR analysis was performed on mRNA for MMP‐2. At least three independent experiments were performed. Data are presented as the mean ± SEM. *p < 0.05 and **p < 0.01 (vs. control), the connection represents a comparison between two groups. Arg1: arginase1; CTRP9: C1q/TNF‐related protein‐9; ELISA: enzyme‐linked immunosorbent assay; GAPDH: glyceraldehyde 3‐phosphate dehydrogenase; IFN‐γ: interferon‐γ; iNOS: inducible nitric oxide synthase; LPS: lipopolysaccharide; mRNA: messenger RNA; PCR: polymerase chain reaction; qRT‐PCR: quantitative reverse‐transcription PCR [Color figure can be viewed at wileyonlinelibrary.com]
