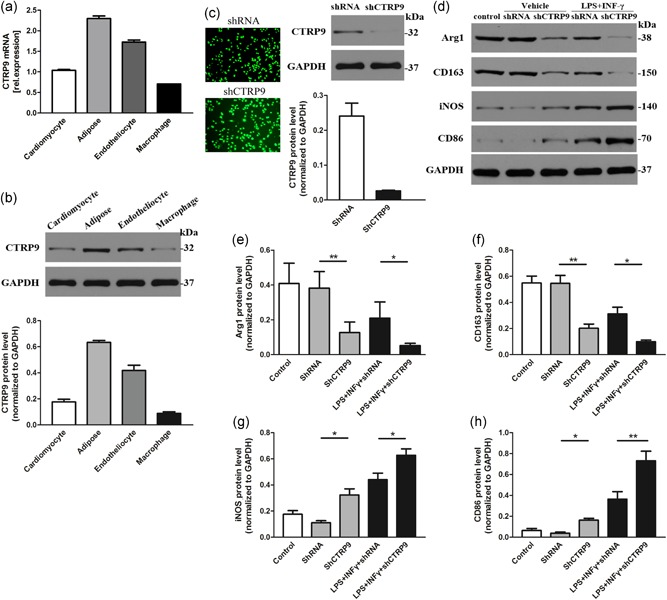
Figure 4.

CTRP9 deficiency enhances the M1 macrophage phenotype. (a–b) mRNA and protein levels of CTRP9 in 4 kinds of cells. (c) Representative fluorescence microscopy images of GFP fluorescence in macrophages after transfection of shRNA and shCTRP9, and corresponding protein levels determined by western blot analysis. (d–h) Protein levels of M1 and M2 macrophage markers after knockdown of CTRP9 at baseline and in LPS + IFN‐γ‐induced macrophages for 24 hr. Data are presented as the mean ± SEM from four independent experiments. *p < 0.05 and **p < 0.01, the connection represents a comparison between two groups. Arg1: arginase1; GAPDH: glyceraldehyde 3‐phosphate dehydrogenase; GFP: green fluorescent protein; IFN‐γ: interferon‐γ; LPS: lipopolysaccharide; mRNA: messenger RNA; SEM: standard error of the mean; shRNA: small hairpin RNA [Color figure can be viewed at wileyonlinelibrary.com]
