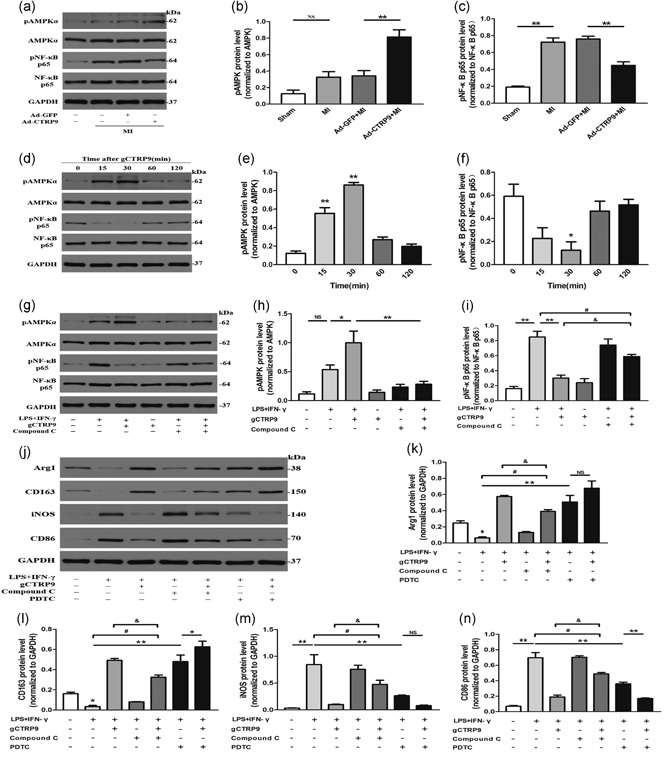
Figure 6.

CTRP9 promotes macrophage polarization partly through AMPK‐mediated activation and largely via an NF‐κB‐dependent pathway. (a–c) The effects of Ad‐GFP and Ad‐CTRP9 transfection on the phosphorylation of AMPK and NF‐κB p65 in the infarct border zone at Day 3 post MI by western blot. (d–f) Effects of treatment of macrophages with gCTRP9 (3 μg/ml) at different time points on AMPK (Thr172) and NF‐κB p65 phosphorylation by western blot analysis. (g–i) Western blot analysis assessed the effects of the AMPK inhibitor compound C on pAMPKα and pNF‐κB p65 protein expression in macrophages responding to gCTRP9 by LPS + IFN‐γ stimulation. Cells were treated with compound C (10 mol/l) for 2 hr and then incubated with CTRP9 (3 µg/ml) for 30 min, followed by LPS + IFN‐γ challenge for 24 hr. (j–n) Effects of two inhibitors (compound C or PDTC; 100 μM) on M1 and M2 marker protein expression in macrophages in response to gCTRP9 via LPS + IFN‐γ stimulation using western blot analysis. Data are shown as the mean ± SEM from three independent experiments; *p < 0.05, **p < 0.01 (vs. control group), &,# p < 0.05, and NS = p > 0.05, the connection represents a comparison between two groups. AMPK: adenosine monophosphate kinase; Arg1: arginase1; CTRP9: C1q/TNF‐related protein‐9; GAPDH: glyceraldehyde 3‐phosphate dehydrogenase; GFP: green fluorescent protein; IFN‐γ: interferon‐γ; LPS: lipopolysaccharide; MI: myocardial infarction; NF‐κB: nuclear factor‐κB; NS: not significant; PDTC: pyrrolidine dithiocarbamate; SEM: standard error of the mean
