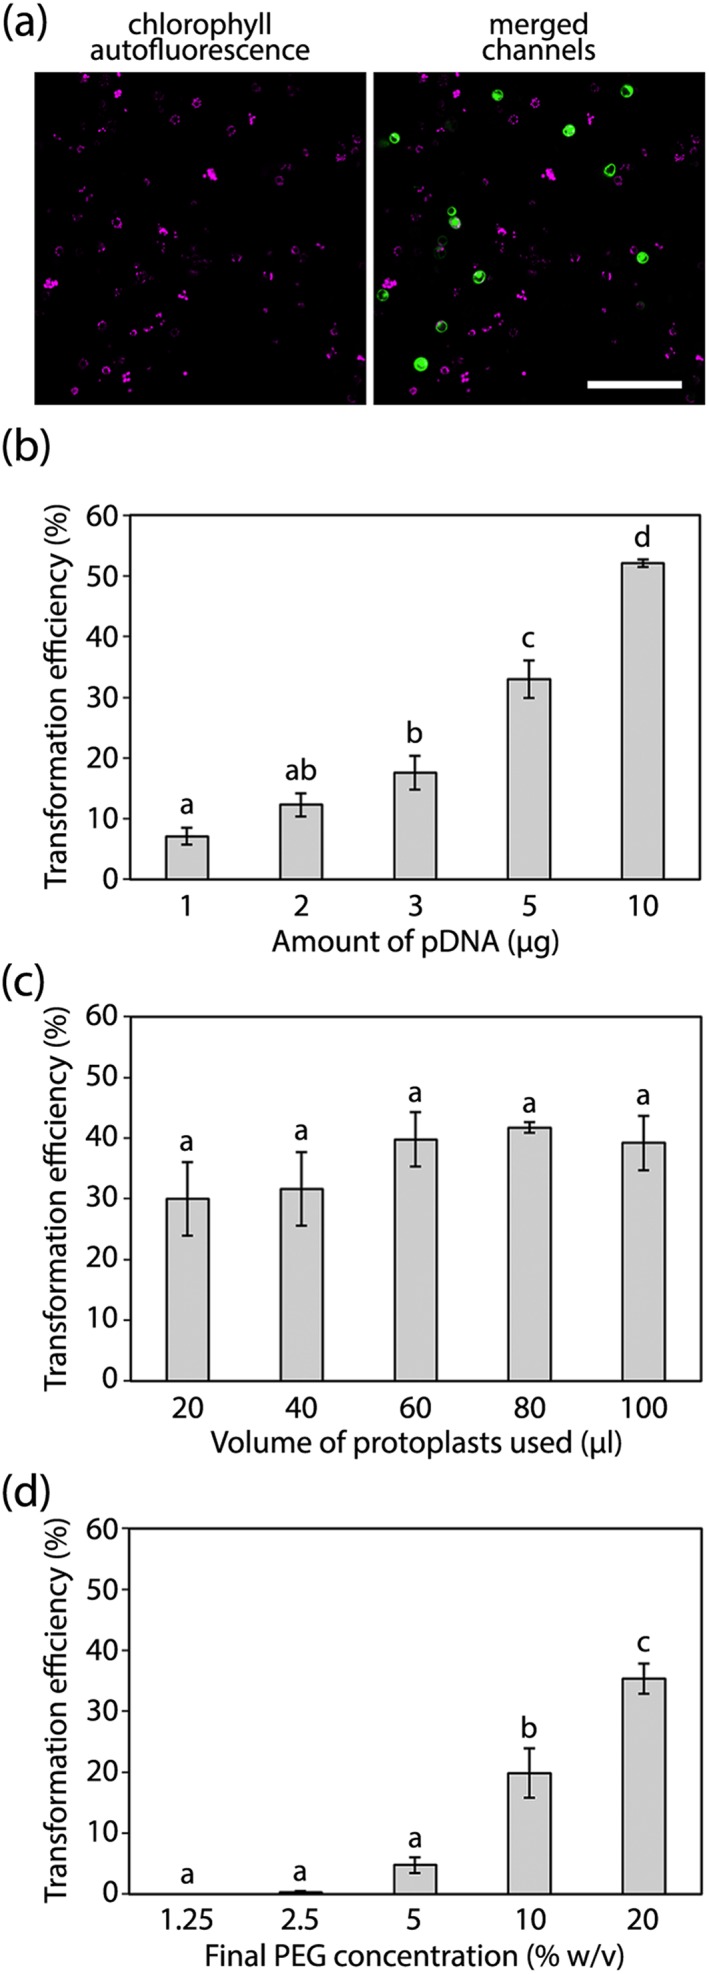
Figure 3.

Factors affecting the transformation efficiency of isolated protoplasts. Representative images of the type of data acquired for this assay (a), showing chlorophyll autofluorescence and its overlay with tGFP. Scale bar represents 100 μm. Assessment of protoplast transformation efficiency under varying amounts of plasmid DNA (pDNA; b), volumes of isolated protoplasts (c), or concentrations of PEG (d). These tests were conducted on three biological replicates (protoplasts isolated from three independent batches of rice plants grown over a period of 4 months). In (b) the volume of isolated protoplasts added was fixed at 60 μL, and the final PEG concentration was fixed at 20%. In (c) the amount of pDNA added was fixed at 5 μg, and the final PEG concentration was fixed at 20%. In (d) the amount of pDNA added was fixed at 5 μg, and the volume of isolated protoplasts added was fixed at 60 μL. For each treatment within each biological replicate, six representative and nonoverlapping images (consisting of between 125 and 350 protoplasts) were acquired for analysis. Bars represent the mean of the three biological replicates, error bars represent ±1 × SEM. For the different treatments, lowercase letters denote significant differences between sample means (p < 0.05)
