
Figure 3.
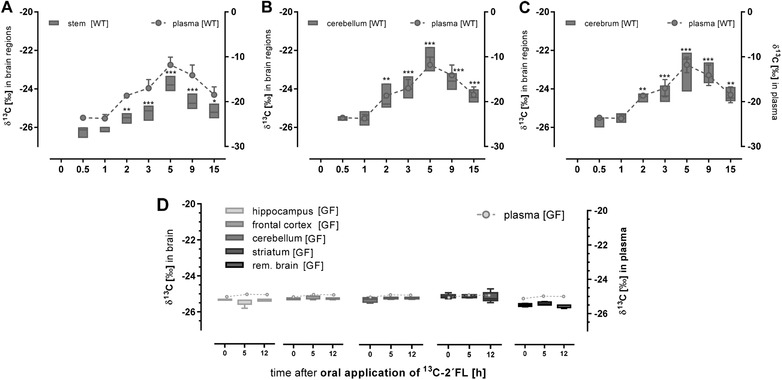
13C‐enrichment (δ 13C in 0/00) in brain sections (left axis) and plasma (right axis). Wild‐type (WT; treated n = 5) and germ‐free mice (GF; treated n = 4) received 1 g per kg body weight 13C‐labelled 2´FL by oral gavage. After the time points indicated, mice were sacrificed and the brain of A–C) WT mice was separated in stem, cerebellum, and cerebrum and D) of GF micein hippocampus, striatum, frontal cortex, cerebellum, and remaining brain. 13C‐enrichment was measured by EA‐IRMS. Data are depicted as box plots with median and min–max whiskers; data for plasma are shown as mean ± SD (differences to corresponding controls were significant at **p < 0.01 and ***p < 0.001).