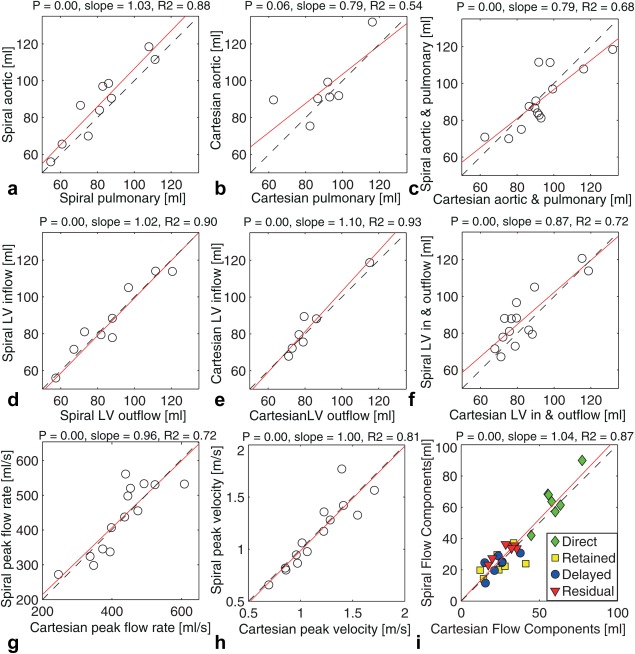
Figure 4.

Plots of result from linear regression analysis comparing aortic and pulmonary flow for spiral (a) and Cartesian (b) data. Plots of pathline analysis left‐ventricle (LV) inflow and outflow for spiral (d) and Cartesian (e) data. Results of comparison between spiral and Cartesian flow values from aortic/pulmonary comparison (c) and pathline LV flow analysis (f) are also included. Moreover, spiral and Cartesian peak flow rate (g) and peak velocity are plotted, as well as four flow components (combined) (i). Dashed line shows identity line, and solid line shows regression line.
