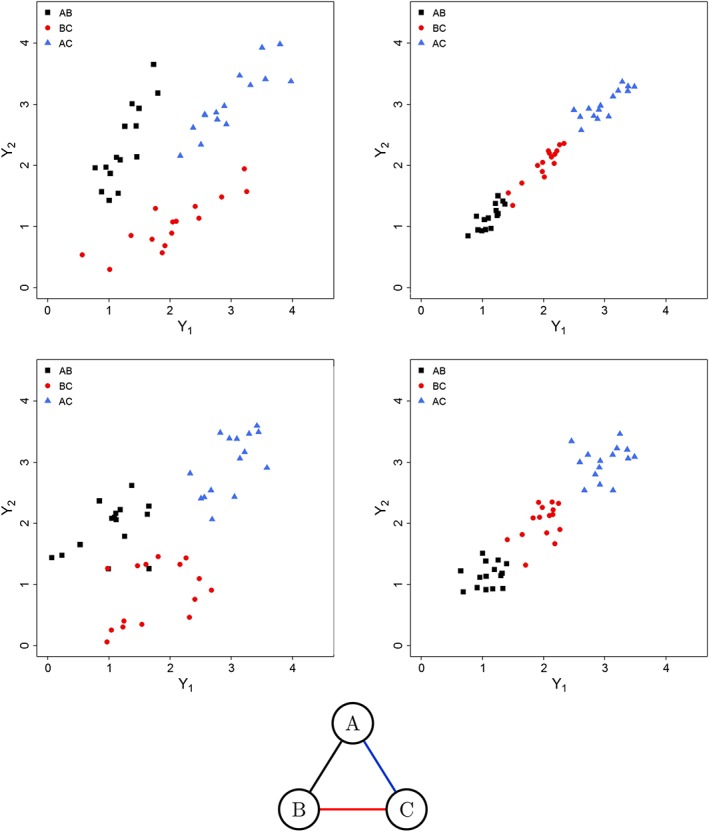
Figure 3.

Scatter plots of the artificial data simulated under scenario 1 (top left), scenario 2 (top right), scenario 3 (bottom left), and scenario 4 (bottom right) and network diagram corresponding to the structure of data for both scenarios [Colour figure can be viewed at wileyonlinelibrary.com]
