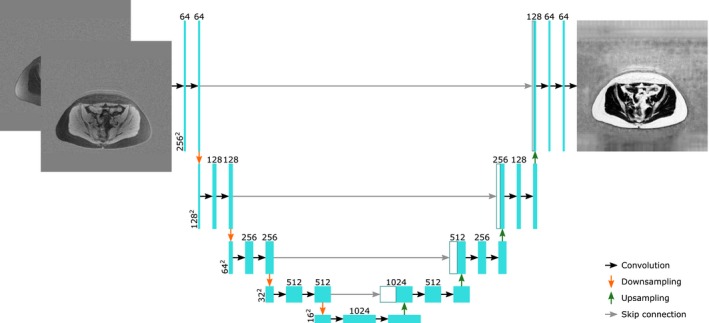
Figure 1.

A visual representation of 1 of the networks used in this manuscript, with an axial slice containing the real and the imaginary parts of the first echo as input and the corresponding fat fraction map as output. The cyan boxes represent feature maps. The white boxes represent feature maps that have been transferred by the skip connections. The horizontal numbers represent the number of features in a layer and the vertical numbers represent the number of elements per feature of the layer
