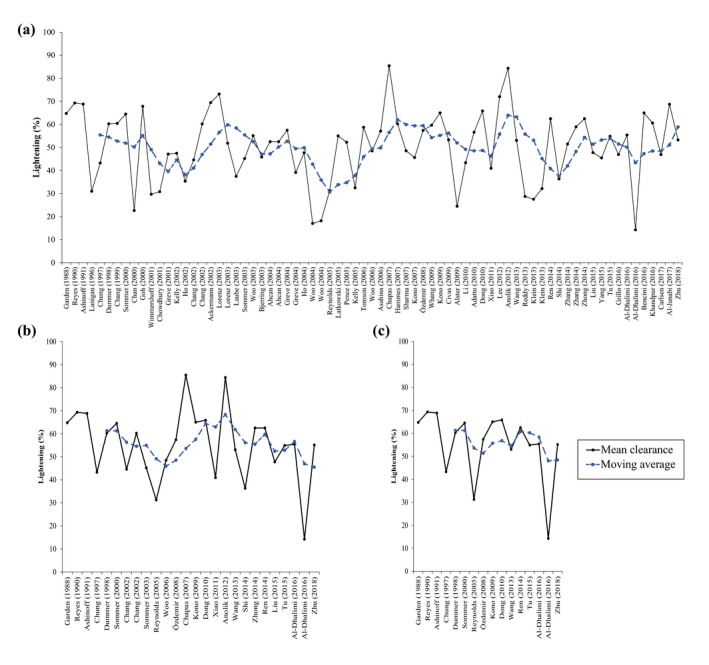
Figure 2.

The mean clearance score per study or treatment arm (; black line) and the five‐study/treatment arm simple moving average for clearance (; blue dotted line) are plotted in chronological order. The panels (a–c) correspond to the panels and data subsets in Fig. 1.
