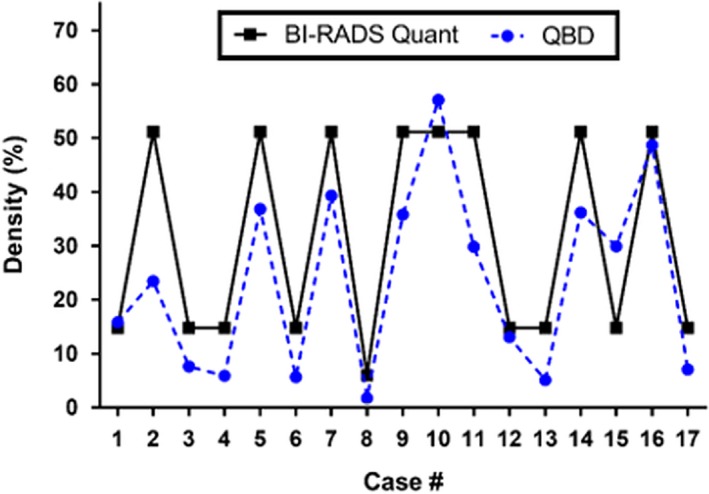
Figure 10.

Comparison of quantitative breast density (QBD) values and BI‐RADS‐based subjective breast density scores.17 The vertical axis is the percentage of total breast volume that is fibroglandular tissue — either the QBD value or the subjective value assigned to BiRADS composition categories. [Color figure can be viewed at wileyonlinelibrary.com]
