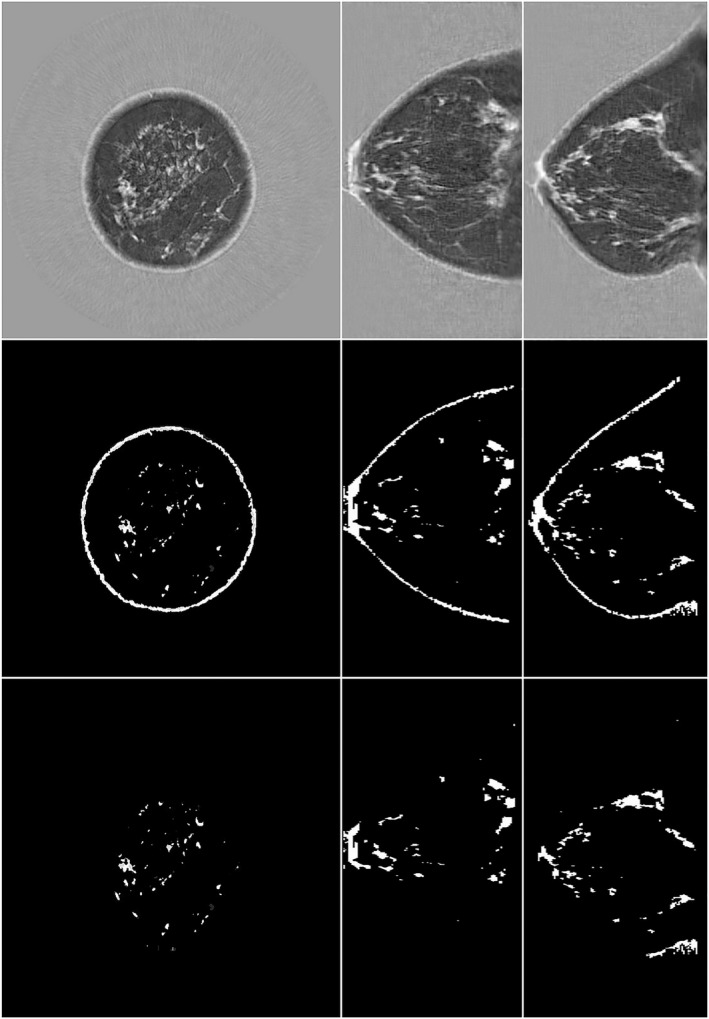
Figure 12.

Transmission ultrasound images of a fatty breast quantitative breast density (QBD = 10.9%). Top row, speed of sound image; L to R: coronal, axial sagittal image. Middle row, fibroglandular tissue and skin segmented from the total breast tissue volume. Bottom row, remaining fibroglandular tissue following the segmentation and removal of skin. The segmentation is based on speed of sound > 1489 m/s.
