Figure 1.

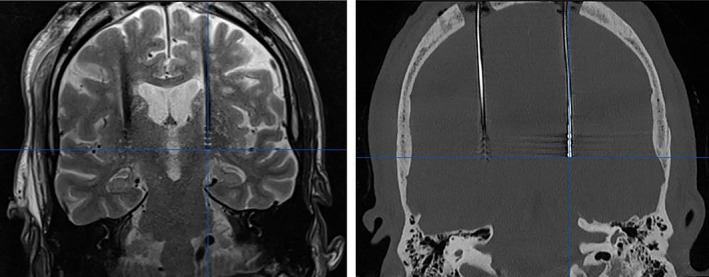
DBS leads of the same patient on MRI (left) and on iCT (before windowing; right). The MRI artifact is depicted as a hypodense signal whereas the CT artifact is hyperdense. [Color figure can be viewed at wileyonlinelibrary.com]

DBS leads of the same patient on MRI (left) and on iCT (before windowing; right). The MRI artifact is depicted as a hypodense signal whereas the CT artifact is hyperdense. [Color figure can be viewed at wileyonlinelibrary.com]