
Figure 5.
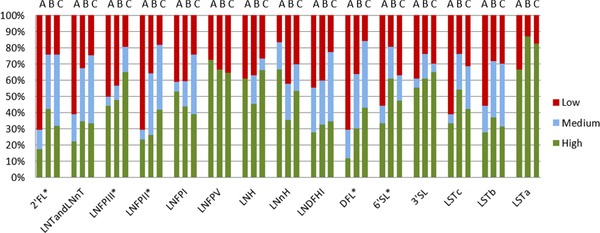
Proportion of infants showing either “high,” “medium,” or “low” HMO consumption levels, within each microbial cluster class A, B, C. Significant differences in distribution as determined by Chi‐square analysis are indicated with an asterisk.