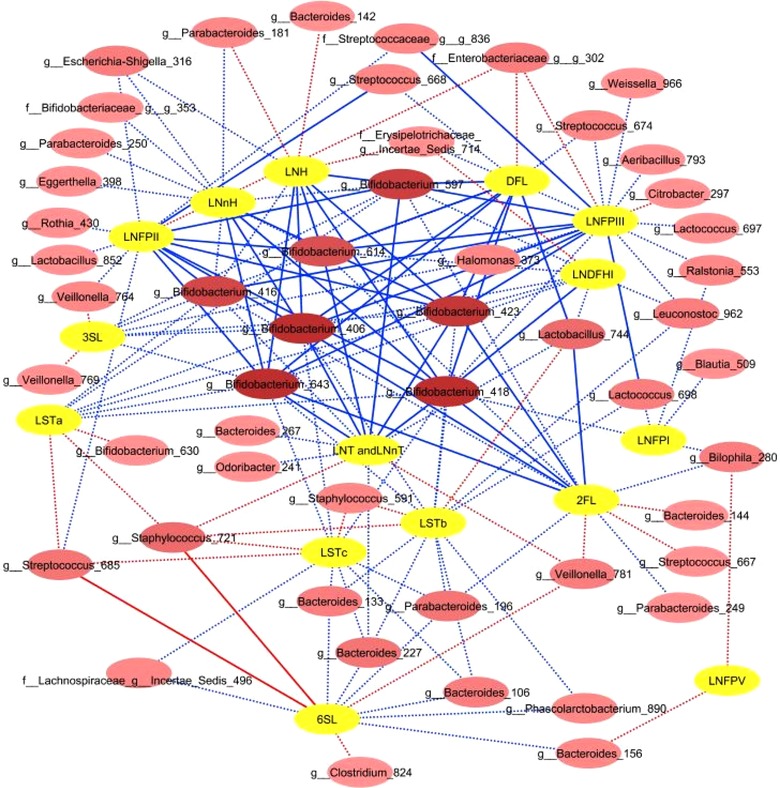
Figure 6.

OTUs significantly associated with HMO consumption based on Kruskal–Wallis test including infants classified as high and low consumers for each HMO. Red lines indicate higher OTU relative abundance in relation to low HMO consumption; blue lines indicate higher relative abundance in relation to high consumption. OTU nodes which are connected with the highest number of HMOs are indicated by darker shades of pink. Dotted lines indicate associations with p < 0.05; solid lines indicate associations with FDR <0.05.
